|
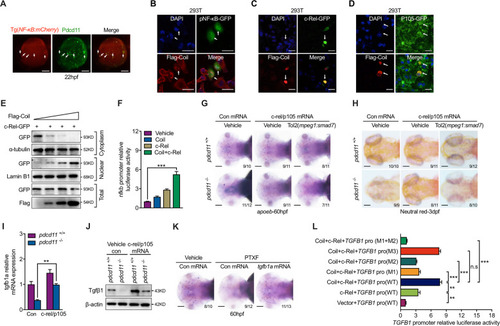
PDCD11 promotes c-Rel mediated NF-κB activation.a IF assay of Pdcd11 expression in Tg(NF-κB:mCherry) transgenic line. White arrowheads indicate the colocalized cells on the YS at 22 hpf. Scale bar: 100 μm. b In vitro transfection of plasmid containing NF-κB recognition motif driven GFP and Flag-Coil. White arrows indicate that cells with nuclear Coil expression displayed NF-κB activation. Scale bar: 20 μm. Representative image show cells co-transfected with Flag-Coil and c-Rel (c) or P105 (d). White arrows indicate that cells with nuclear expressed Coil and c-Rel (c) or P105 (d). Scale bar: 20 μm. e. Western blot showing the effect of increasing Coil transfection on nuclear/cytoplasm c-Rel content. f Influence of Coil and c-Rel transfection on luciferase activities driven by the NF-κB-binding site. Microglia numbers in WT and pdcd11 mutants examined by apoeb (g) or Neutral Red staining (h) with c-rel and p105 mRNA or combined mpeg1 promoter driven smad7 plasmid injection. Scale bar: 100 μm. qPCR (i) and western blot (j) assessment of tgfb1a or Tgfβ1 level in 22 hpf WT and pdcd11 mutants with c-Rel and p105 mRNA overexpression. k Microglia numbers in embryos with c-Rel inhibition (PTXF) or combined tgfb1a mRNA complementation. Scale bar: 100 μm. l Reporter assay showing the regulation of TGFB1 promoter by Coil and c-Rel transfection. TGFB1 WT promoter containing three c-Rel-binding sites (5′-ccGGGGcacccccc-3′, −761 bp to TSS; 5′-ggGGGGacgccccgt-3′, −776 bp to TSS; 5′-aaGGGAcccccctcg-3′, −1019 bp to TSS). The three binding motifs were respectively mutated and designated as M1 (5′-ccAAAAcacccccc-3′, −761 bp to TSS), M2 (5′-ggAAAAacgccccgt-3′, −776 bp to TSS), M3 (5′-aaAAACcccccctcg-3′, −1019 bp to TSS). The number positioned in the lower right corner of g, h, k represents the number of zebrafish embryos shown positive phenotypes versus the total number of embryos examined. Means ± SEM are shown for three independent experiments. n.s not significant, *P < 0.05; **P < 0.01; ***P < 0.001 (Student’s t test).
|