|
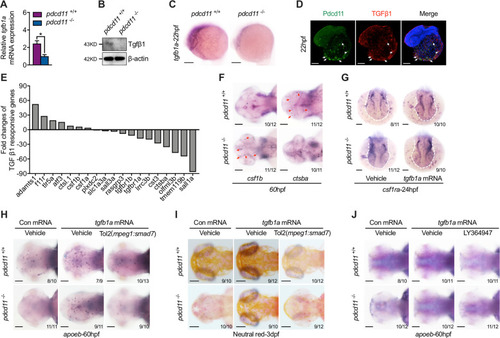
Reduced TGF-β1 signature genes in <italic>pdcd11</italic>-deficient macrophages.qPCR (a), western blot (b) and WISH (c) examination of the expression levels of tgfb1a or Tgfβ1 in 22 hpf zebrafish. d Immunofluorescence assessment of Pdcd11 and Tgfβ1 expression in 22 hpf zebrafish embryos. White arrows indicate the co-expressed signals found on the YS. e Fold changes of Tgfβ1-regulated genes expression in macrophages sorted from the brains of 60 hpf pdcd11 mutants as compared with WT controls using Tg(mpeg1:GFP) transgenic line. f. Expression of csf1b and ctsba in 60 hpf WT and pdcd11 mutants by WISH. Red arrows indicate the positive cells. g Effect of zebrafish tgfb1a mRNA overexpression on csf1ra expression in WT and pdcd11 mutants. Effect of tgfb1a mRNA or combined mpeg1 driven smad7 overexpression on microglia markers apoeb (h) or Neutral Red staining (i) in WT and pdcd11 mutants. j The effect of LY364947 addition on apoeb expression in WT and pdcd11 mutants with tgfb1a mRNA overexpression. The number positioned in the lower right corner of f–j represent the number of zebrafish embryos shown positive phenotypes versus the total number of embryos examined. Scale bar: 100 μm. Means ± SEM are shown for three independent experiments. *P < 0.05 (Student’s t test).
|