|
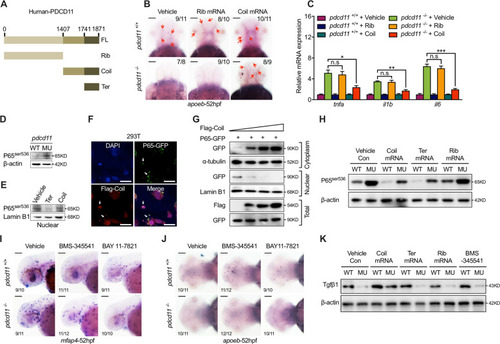
P65 hyperactivation in <italic>pdcd11</italic> mutants.a Schematic diagram showing different domains of PDCD11 consisting of Ribosome (Rib, 1-1407 aa), Coil (1408-1871 aa), and Terminal (Ter, 1742-1871 aa) domains. b Rescuing effects on apoeb positive microglia of pdcd11 mutants with the Rib or Coil domain mRNA overexpression. Red arrows indicate the apoeb positive cells. Scale bar: 100 μm. c qPCR assessment of inflammatory genes expression in pdcd11 mutants with Rib or Coil domain of PDCD11 overexpression. d Western blot examination of the 536-serine modified P65 expression in 22 hpf WT and pdcd11 mutants. e Western blot examination of nuclear P65536 contents with the Coil or Ter overexpression in HEK293T cells. f Immunofluorescence assay showing the expression pattern of cells co-transfected with N-terminal Flag fused Coil and P65-GFP. White arrowheads indicate the colocalized Coil and P65 in the cytoplasm or nucleolus. Scale bar: 20 μm. g Representative image of three independent experiments showing the effect of increasing Coil transfection on nuclear/cytoplasm P65 content. h Representative image of three independent experiments showing P65536 levels in WT and pdcd11 mutants with Coil domain (Coil), Terminal domain (Ter), or Ribosome domain (Rib) mRNA overexpression. i Appearance of mfap4 expressing macrophages in pdcd11 mutants treated with NF-κB inhibitor. Scale bar: 50 μm. j Rescuing effect of NF-κB inhibitors on apoeb positive microglia in pdcd11 mutants. Scale bar: 100 μm. k Representative image of three independent experiments showing the rescue effects of Tgfβ1 levels with Coil domain (Coil), Terminal domain (Ter), Ribosome domain (Rib) mRNA or NF-κB inhibitor addition in 22 hpf pdcd11 mutants. The number positioned in the upper right corner of b and lower right corner of i, j represent the number of zebrafish embryos shown positive phenotypes versus the total number of embryos examined. Means ± SEM are shown for three independent experiments. n.s not significant, *P < 0.05; **P < 0.01; ***P < 0.001 (Student’s t test).
|