
Fig. 8
- ID
- ZDB-FIG-210210-15
- Publication
- Cambier et al., 2020 - Spreading of a mycobacterial cell surface lipid into host epithelial membranes promotes infectivity
- Other Figures
- All Figure Page
- Back to All Figure Page
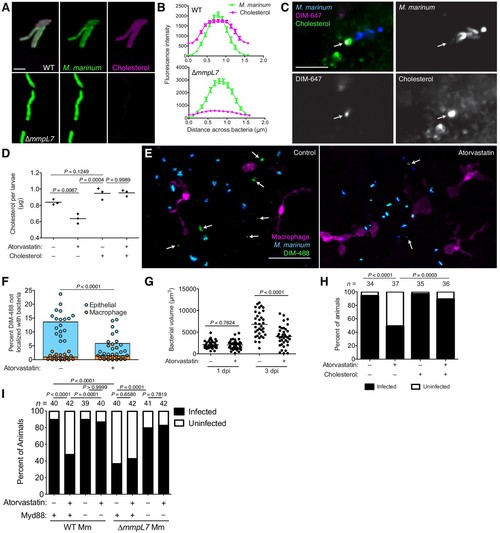
Host cholesterol promotes PDIM spread and mycobacterial infectivity. (A) Images of wildtype (WT) and ∆mmpL7 M. marinum expressing a green-fluorescent protein following 48 hr incubation with alkyne-cholesterol reacted with AlexaFlour647 Azide, scale bar = 3 μm. (B) Mean (± SEM) fluorescent intensity of line profiles drawn perpendicular to poles of WT and ∆mmpL7 M. marinum labeled as in A. (C) Image of A549 epithelial cells labeled with BODIPY-cholesterol at 1 dpi with DIM-647 labeled M. marinum at an MOI of 5. Arrows, spread DIM-647 co-localizing with BODIPY-cholesterol, scale bar = 10 μm. (D) Mean cholesterol content of 3 dpf zebrafish following a 24 hr treatment with atorvastatin, water-soluble cholesterol, or both. Ordinary one-way ANOVA with Tukey’s multiple comparisons test with selected adjusted P values shown. (E) Images of control or atorvastatin treated transgenic fish whose macrophages express tdTomato at 2 hpi with ~100 M. marinum expressing a cytosolic blue-fluorescent protein recoated with DIBO-488 labeled azido-DIM (DIM-488), scale bar = 40 μm. Arrows, DIM-488 spread onto epithelial cells. (F) Mean percent DIM-488 in macrophage or epithelial cells not localized with bacteria at 2 h following HBV infection with ~100 M. marinum in control or atorvastatin treated fish. Two-tailed, unpaired t test. (G) Mean bacterial volume following HBV infection of control or atorvastatin treated fish with ~100 M. marinum. Two-tailed Mann Whitney test for 2 hpi and two-tailed, unpaired t test for 24 hpi. (H) Percentage of infected or uninfected fish at 3 dpi into the HBV with 1–3 wildtype M. marinum with or without atorvastatin and water-soluble cholesterol. (I) Percentage of infected or uninfected wildtype or Myd88-depleted fish at 3 dpi into the HBV with 1–3 wildtype or ∆mmpL7 M. marinum with or without atorvastatin. (H) and (I) Fisher’s exact test with Bonferroni’s correction for multiple comparisons. (B)-(D) and (F)-(I) representative of three separate experiments. |