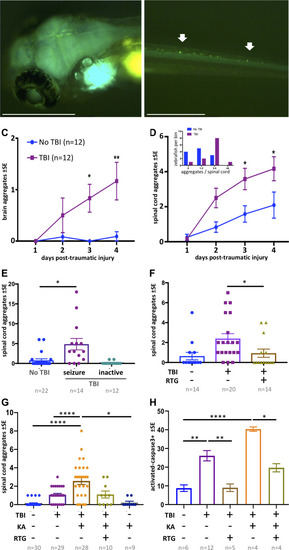
Traumatic brain injury (TBI) induces tauopathy in larval zebrafish. (A) GFP+ Tau puncta are detected in the brain of Tau4R-GFP biosensor zebrafish at 5 days post-traumatic brain injury (dpti). A 300 g weight was used to induce TBI throughout this figure. (B) Tau aggregates formed on the spinal cord as a result of the TBI as shown by arrows. (C) Tauopathy significantly increases over time following TBI compared to control group (No TBI) *p=0.0264, **p=0.007, two-way ANOVA with Tukey’s multiple comparison test. (D) The number of Tau aggregates in spinal cord significantly increases over time following TBI compared to control group (*p=0.0224 at 3dpti and *p=0.0312 at 4dpti). Inset: Tau4R-GFP zebrafish larvae subjected to TBI develop more GFP+ puncta compared to the control group by 3dpti (inset plot is similar to Figure 2E). Figure 5—figure supplements 2 and 3 plot this in individual fish. (E–H) Post-traumatic seizures link TBI to tauopathy. (E) Following TBI, larvae displaying post-traumatic seizures developed many more Tau aggregates relative to those not displaying post-traumatic seizures (**p=0.0011, Kruskal-Wallis ANOVA with Dunn’s multiple comparison test). (F) Inhibiting post-traumatic seizures with the anti-convulsant retigabine (RTG, 10 μM) significantly decreased the abundance of GFP+ puncta in the spinal cord (p=0.0107, Mann-Whitney test). (G) Increasing post-traumatic seizure using the convulsant kainate (KA, 100 μM; see dose-response in Figure 5—figure supplement 5) significantly increased the formation of Tau aggregation following TBI; this effect was prevented by co-treatment with anti-convulsant RTG. ****p<0.0001, ordinary one-way ANOVA with Tukey’s multiple comparison test. (H) Blunting post-traumatic seizures with RTG reduced TBI-related cell death. The main impact of RTG was specific to its anticonvulsant modulation of seizures because its effects were reversed by convulsant KA. Color scheme in panel C applies to other panels. n = number of zebrafish larvae. ****p<0.0001, ordinary one-way ANOVA with Tukey’s multiple comparison test. Scale bars = 500 μm.
|
