
Figure 4.
- ID
- ZDB-FIG-210208-74
- Publication
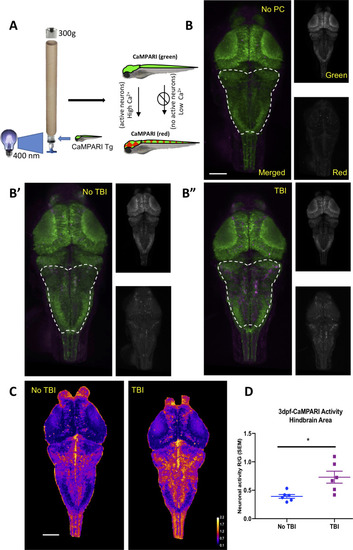
- Alyenbaawi et al., 2021 - Seizures are a druggable mechanistic link between TBI and subsequent tauopathy
- Other Figures
-
- Figure 1
- Figure 1; supplement 1.
- Figure 1; supplement 2.
- Figure 1; supplement 3.
- Figure 2.
- Figure 3
- Figure 3; supplement 1.
- Figure 4.
- Figure 5
- Figure 5; supplement 1.
- Figure 5; supplement 3.
- Figure 5; supplement 4.
- Figure 5; supplement 5.
- Figure 5;supplement 2.
- Figure 6
- Figure 6;supplement 1.
- Figure 7.
- All Figure Page
- Back to All Figure Page
( |
| Fish: | |
|---|---|
| Condition: | |
| Observed In: | |
| Stage: | Protruding-mouth |