|
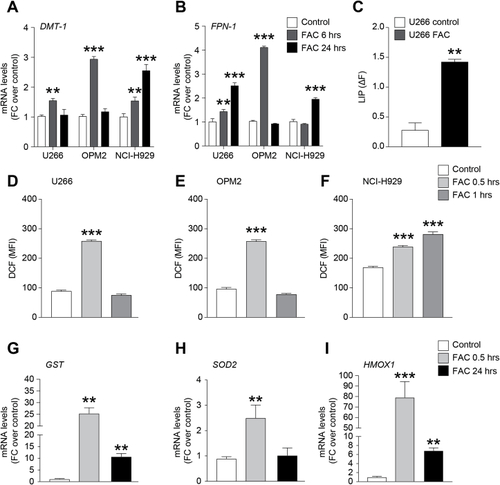
Myeloma cell lines intake and accumulate iron. DMT-1 (A) and FPN-1 (B) mRNA levels in U266, OPM2 and NCI–H929 myeloma cell lines at 6 and 24 h after 400 μM FAC exposure; data are expressed as mean of FC over control; C) LIP evaluated in U266 cells; data are expressed as mean of ΔF ± SEM; ΔF = MFICA-AM/DF-MFICA-AM. **p-value <0.01 and ***p-value <0.001 versus control. D-F). Cellular ROS production evaluated in U266 (D), OPM2 (E) and NCI–H929 (F) cells after 0.5 and 1 h FAC exposure; data are expressed as mean of dichlorofluorescein (DCF) fluorescence intensity (MFI) ± SEM; G-I) GST (G), SOD2 (H) and HMOX1 (I) mRNA levels in U266 cell line after 0.5 and 24 h treatment with FAC; data are expressed as mean of FC over control. **p-value <0.01 and ***p-value <0.001 versus control.
|