Camiolo, G., Barbato, A., Giallongo, C., Vicario, N., Romano, A., Parrinello, N.L., Parenti, R., Sandoval, J.C., García-Moreno, D., Lazzarino, G., Avola, R., Palumbo, G.A., Mulero, V., Li Volti, G., Tibullo, D., Di Raimondo, F.
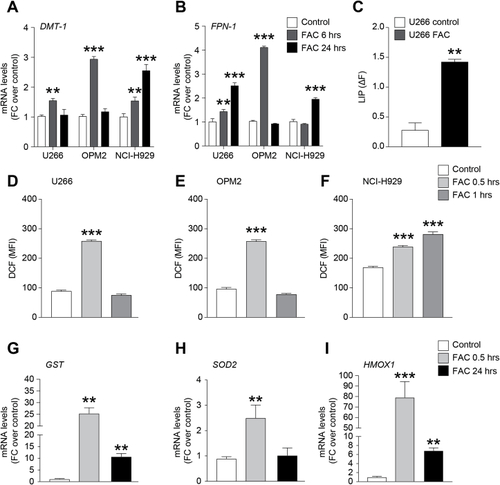
Myeloma cell lines intake and accumulate iron. DMT-1 (A) and FPN-1 (B) mRNA levels in U266, OPM2 and NCI–H929 myeloma cell lines at 6 and 24 h after 400 μM FAC exposure; data are expressed as mean of FC over control; C) LIP evaluated in U266 cells; data are expressed as mean of ΔF ± SEM; ΔF = MFICA-AM/DF-MFICA-AM. **p-value <0.01 and ***p-value <0.001 versus control. D-F). Cellular ROS production evaluated in U266 (D), OPM2 (E) and NCI–H929 (F) cells after 0.5 and 1 h FAC exposure; data are expressed as mean of dichlorofluorescein (DCF) fluorescence intensity (MFI) ± SEM; G-I) GST (G), SOD2 (H) and HMOX1 (I) mRNA levels in U266 cell line after 0.5 and 24 h treatment with FAC; data are expressed as mean of FC over control. **p-value <0.01 and ***p-value <0.001 versus control.
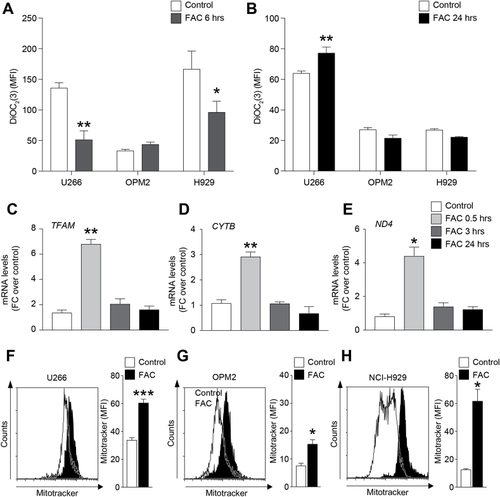
Iron increases myeloma cell lines mitochondrial content. A-B) Mitochondrial membrane potential evaluated in HMCLs stained with DiOC2(3); data are shown as mean of MFI ± SEM. C-E) TFAM (C), CYTB (D) and ND4 (E) mRNA levels in U266 cell line after 0.5, 3 and 24 h FAC exposure; data are expressed as mean of FC over control ± SEM. F–H) Representative plots and quantification of mitochondrial mass analysis using MitoTracker probe in HMCLs 24 h after FAC treatment; data are shown as mean of MFI ±SEM. *p-value < 0.05, **p-value < 0.01 and ***p-value < 0.001 versus control.
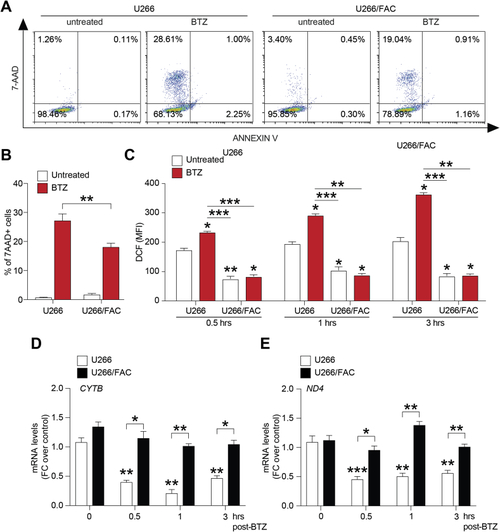
Iron induces bortezomib resistance in myeloma PCs. A-B) Representative dot plots (A) and quantification (B) of the percentage of apoptotic cells after 24 h treatment with15 nM BTZ on the viability in U266 and U266/FAC cells; data are expressed as mean % ± SEM; **p-value < 0.01 between groups. C) Cellular ROS production evaluated in U266 cells after 0.5, 1 and 3 h post BTZ treatment; data are expressed as dichlorofluorescein (DCF) MFI ± SEM. D) CYTB and ND4 mRNA levels in U266 cell line after 0.5, 1 and 3 h BTZ treatment; data are expressed as mean of FC over control ±SEM. E) Cellular ROS production evaluated in U266/FAC cells after 0.5, 1 and 3 h BTZ treatment; data are expressed as mean of DCF MFI ±SEM. F) CYTB and ND4 mRNA levels in U266/FAC cells after 0.5, 1 and 3 h BTZ exposure; data are expressed as mean of FC over control ±SEM. **p-value < 0.01 and ***p-value < 0.001; ##p-value < 0.01 and ###p-value < 0.001versus control.
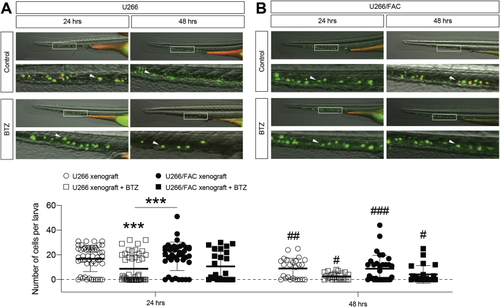
Iron reduces bortezomib sensitivity of engrafted myeloma PCs in zebrafish larval model. A) Representative image and stereological quantification of engrafted U266 (A) and U266/FAC (B) cells in zebrafish larvae after 24 and 48hrs BTZ treatment; data are shown as scattered dot plots and mean ± SD (each dot represents a larva); ***p-value <0.001 versus control, #p-value<0.05, ##p < 0.01, ###p-value<0.001 versus corresponding 24 h, Mann-Whitney t-test.
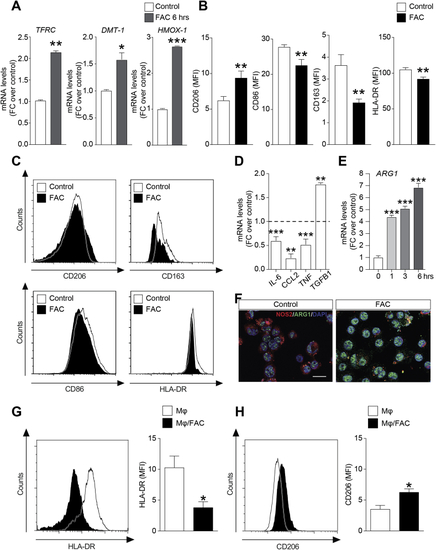
Iron promotes immuno-suppressive phenotype in human monocytes. (A) TFRC, DMT-1 and HMOX-1 mRNA levels in U937 cell line after 6 h 100 μM FAC treatment; data are expressed as mean FC over control ± SEM; B–C) Flow cytometric analysis of CD206, CD163, CD86 and HLA-DR in U937 cell line after FAC treatment. D) IL-6, CCL2, TNFα, TGFβ1 and mRNA levels in U937 cells after 24 h FAC exposure; data are expressed as mean of FC over control ± SEM; E) ARG1 mRNA levels after 1, 3 and 6 h FAC treatment; data are expressed as mean of FC over control ± SEM; F) Immunofluorescence pictures of ARG1 (green) and NOS2 (red) expression in control and U937 cells treated with FAC. Scale bar: 20 μm. Representative plots and quantifications of HLD-DR (H) and CD206 (G–H) MFI in human healthy donors-derived primary Mϕ after 24 h FAC exposure; data are shown as mean of MFI ± SEM. *p-value < 0.05, **p-value < 0.01 and ***p-value < 0.001 versus control. (For interpretation of the references to colour in this figure legend, the reader is referred to the Web version of this article.)
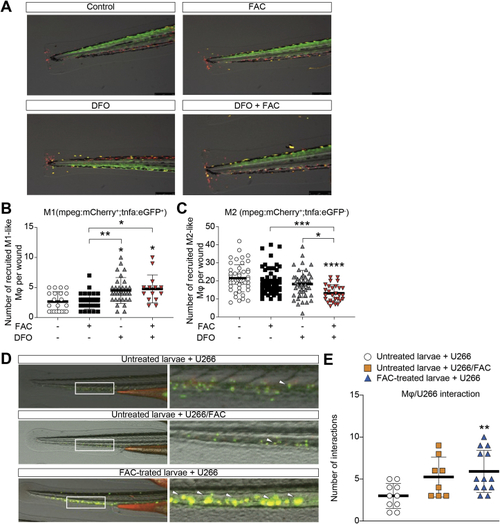
Iron promotes M2 phenotype and PCs-macrophage interactions in zebrafish. A) Representative images of M1 and M2 macrophages in Tg (mpeg1:mCherry;tnfa: eGFP) double transgenic larvae after 6 h treatment with FAC, DFO or their combination. B–C) Quantification of M1 (mCherry+/eGFP+: yellow) and M2 (mCherry+/eGFP-: red) macrophages in damaged area per larva. **p < 0.01 and ***p < 0,001, ANOVA and Kruskal-Wallis multiple comparisons test. D) Representative images of engrafted U266, U266/FAC cells and U266-injected larvae exposed to FAC (FAC-treated larvae) at 24 h. E) Engrafted U266 cells interacting with endogenous Mϕ per larva in the CHT 24 h post-injection. Data are shown as mean ± SD. versus control (larvae injected with U266 cell line); *p-value < 0.05, **p-value < 0.01 and ***p-value < 0.001 versus control. Each dot represents a larva. (For interpretation of the references to colour in this figure legend, the reader is referred to the Web version of this article.)
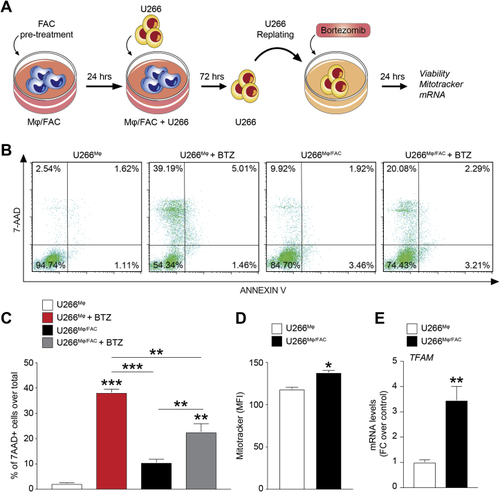
Iron-exposed monocytes reduce bortezomib sensitivity of myeloma PCs. A) Experimental paradigm of primary human monocytes (Mϕ) and U266 cells cocultures. Representative dot plots (B) and quantification (C) of apoptotic cells after BTZ treatment in U266 cells obtained from coculture with Mϕ (U266Mϕ) or from coculture with Mϕ/FAC (U266Mϕ/FAC). Data are shown as mean percentage ±SEM; ***p-value < 0.001 and **p-value < 0.01 versus controls or between groups. D) Quantification of mitochondrial mass analysis using MitoTracker probe in U266Mϕ and U266Mϕ/FAC cells; data are shown as mean of MFI ±SEM; E) TFAM mRNA levels U266Mϕ and U266Mϕ/FAC cells; data are expressed as mean of FC over control ±SEM; *p-value < 0.05 and **p-value < 0.01 versus control.
Acknowledgments
This image is the copyrighted work of the attributed author or publisher, and
ZFIN has permission only to display this image to its users.
Additional permissions should be obtained from the applicable author or publisher of the image.
Full text @ Redox Biol.
Your Input Welcome
Thank you for submitting comments. Your input has been emailed to ZFIN curators who may contact you if
additional information is required.
Oops. Something went wrong. Please try again later.