|
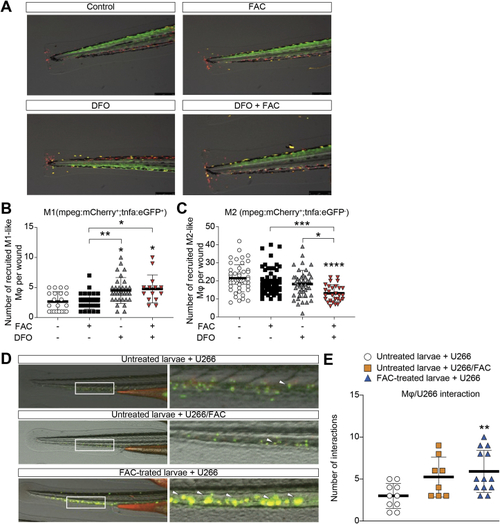
Iron promotes M2 phenotype and PCs-macrophage interactions in zebrafish. A) Representative images of M1 and M2 macrophages in Tg (mpeg1:mCherry;tnfa: eGFP) double transgenic larvae after 6 h treatment with FAC, DFO or their combination. B–C) Quantification of M1 (mCherry+/eGFP+: yellow) and M2 (mCherry+/eGFP-: red) macrophages in damaged area per larva. **p < 0.01 and ***p < 0,001, ANOVA and Kruskal-Wallis multiple comparisons test. D) Representative images of engrafted U266, U266/FAC cells and U266-injected larvae exposed to FAC (FAC-treated larvae) at 24 h. E) Engrafted U266 cells interacting with endogenous Mϕ per larva in the CHT 24 h post-injection. Data are shown as mean ± SD. versus control (larvae injected with U266 cell line); *p-value < 0.05, **p-value < 0.01 and ***p-value < 0.001 versus control. Each dot represents a larva. (For interpretation of the references to colour in this figure legend, the reader is referred to the Web version of this article.)
|