|
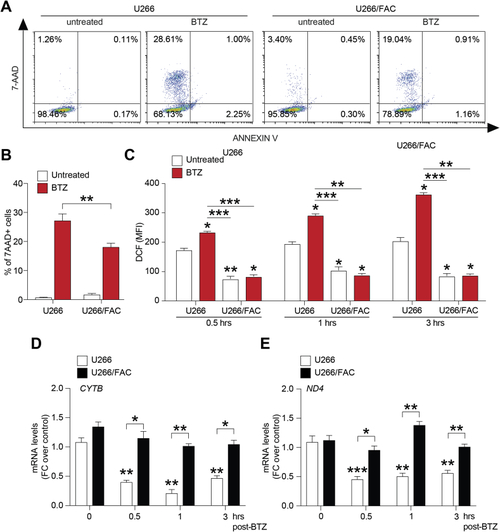
Iron induces bortezomib resistance in myeloma PCs. A-B) Representative dot plots (A) and quantification (B) of the percentage of apoptotic cells after 24 h treatment with15 nM BTZ on the viability in U266 and U266/FAC cells; data are expressed as mean % ± SEM; **p-value < 0.01 between groups. C) Cellular ROS production evaluated in U266 cells after 0.5, 1 and 3 h post BTZ treatment; data are expressed as dichlorofluorescein (DCF) MFI ± SEM. D) CYTB and ND4 mRNA levels in U266 cell line after 0.5, 1 and 3 h BTZ treatment; data are expressed as mean of FC over control ±SEM. E) Cellular ROS production evaluated in U266/FAC cells after 0.5, 1 and 3 h BTZ treatment; data are expressed as mean of DCF MFI ±SEM. F) CYTB and ND4 mRNA levels in U266/FAC cells after 0.5, 1 and 3 h BTZ exposure; data are expressed as mean of FC over control ±SEM. **p-value < 0.01 and ***p-value < 0.001; ##p-value < 0.01 and ###p-value < 0.001versus control.
|