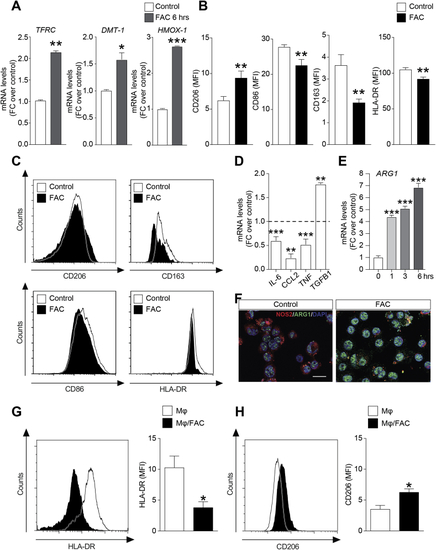
Iron promotes immuno-suppressive phenotype in human monocytes. (A) TFRC, DMT-1 and HMOX-1 mRNA levels in U937 cell line after 6 h 100 μM FAC treatment; data are expressed as mean FC over control ± SEM; B–C) Flow cytometric analysis of CD206, CD163, CD86 and HLA-DR in U937 cell line after FAC treatment. D) IL-6, CCL2, TNFα, TGFβ1 and mRNA levels in U937 cells after 24 h FAC exposure; data are expressed as mean of FC over control ± SEM; E) ARG1 mRNA levels after 1, 3 and 6 h FAC treatment; data are expressed as mean of FC over control ± SEM; F) Immunofluorescence pictures of ARG1 (green) and NOS2 (red) expression in control and U937 cells treated with FAC. Scale bar: 20 μm. Representative plots and quantifications of HLD-DR (H) and CD206 (G–H) MFI in human healthy donors-derived primary Mϕ after 24 h FAC exposure; data are shown as mean of MFI ± SEM. *p-value < 0.05, **p-value < 0.01 and ***p-value < 0.001 versus control. (For interpretation of the references to colour in this figure legend, the reader is referred to the Web version of this article.)
|
