|
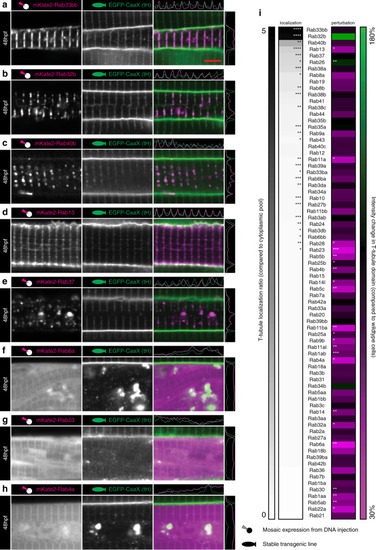
An overexpression screen of Rab proteins.a–e Top five hits for T-tubule localisation. a Rab33bb. b Rab32b. c Rab40b. d Rab13. e Rab37. f–h Top three hits for perturbation of fluorescence amplitude. f Rab6a. g Rab23. h Rab4a. i Ranked heatmap showing specific localisation to the T-tubule domain, and the capacity of Rab overexpression to perturb T-tubule formation. n = 6 fibres per marker, each from individual biologically independent animals per condition, measured over one independent experiment. Two-tailed T-test. *p < 0.05, **p < 0.01, ***p < 0.001, ****p < 0.0001. Exact p values are given in source data. Scale bars, 5 µm. See also Supplementary Fig. 8. All images are representative of 12 individual cells within different individual animals.
|