|
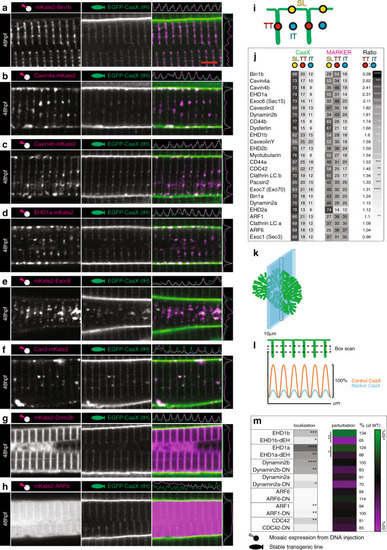
Composition of early T-tubules.Images of the top seven markers for T-tubule localisation, compared to a non-tubule marker (ARF6). a Bin1b. b Cavin4a. c Cavin4b. d EHD1a. e Exoc6. f Caveolin3. g Dynamin2b. h ARF6. Scale bar, 5 µm. i Schematic showing domains used for localisation analysis. TT, T-tubule domain; SL, sarcolemma; IT, inter-tubule domain. j Markers ranked for T-tubule localisation. k Schematic showing the information captured by lateral optical sectioning of T-tubules by confocal microscopy. The average diameter of the T-tubules in the transverse plane was 96 nm when measured precisely by electron microscopy. However these structures can appear to be up as large as 380 nm in the xy plane of confocal microscope images due to light scatter and can increase to 800 nm in the z-plane. In this schematic, the T-tubules are scaled to a 380 nm diameter, and the optical section is scaled to 800 nm. l Schematic showing analysis strategy for assessment of perturbation. A boxed region of interest was placed over an array of eight T-tubules to give the average pixel intensity in the y dimension. This method ensured that quantitative assessment of signal was possible even where T-tubules were fragmented or only partially present. For each sample, amplitude was expressed as a percentage of the wildtype (non-expressing) cell from within the same image. m Comparison of wildtype and dominant negative variants for proteins amenable to such changes. For perturbation and localisation, n = 6 fibres per marker, each from individual biologically independent animals per condition, measured over one independent experiment. Two-tailed T-test. *p < 0.05, **p < 0.01, ***p < 0.001, ****p < 0.0001. Exact p values are given in source data. All images are representative of 12 individual cells within different individual animals.
|