|
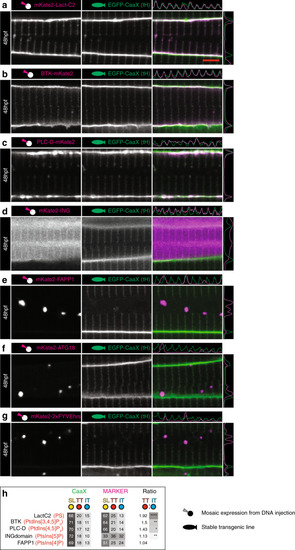
Phosphoinositide signature of early T-tubules.a LactC2 probe for phosphatidylserine (PS). b BTK probe for PtdIns(3,4,5)P2. c PLC-D probe for PtdIns(4,5)P2. d ING probe for PtdIns(5)P. e FAPP1 probe for PtdIns(4)P. f ATG18 probe for PtdIns (3,5)P2. g 2xFYVEhrs probe for PtdIns(3)P. h Ranked heatmap comparing average pixel intensity across each domain (T-tubule, sarcolemma and inter-T-tubule domain), for markers of interest and EGFP-CaaX. n = 6 fibres per marker, each from individual biologically independent animals per condition, measured over one independent experiment. Two-tailed T-test. *p < 0.05, **p < 0.01, ***p < 0.001, ****p < 0.0001. Exact p values are given in source data. Scale bars, 5 µm. All images are representative of 12 individual cells within different individual animals.
|