FIGURE SUMMARY
Title

In vivo cell biological screening identifies an endocytic capture mechanism for T-tubule formation

Authors
Hall, T.E., Martel, N., Ariotti, N., Xiong, Z., Lo, H.P., Ferguson, C., Rae, J., Lim, Y.W., Parton, R.G.
Source
Full text @ Nat. Commun.

An in vivo system for T-tubule development.

ae The CaaX domain from Hras marks both sarcolemma and T-tubule. Markers were screened at 48 hpf for T-tubule specificity on a stable transgenic background expressing Bin1b-Citrine from the endogenous locus. a CaaX domain from Hras (tH). b CaaX domain from Kras (tK). c Myristoylation domain from ARF5. d BODIPY-TR vital dye. e GPI anchor from zebrafish folate receptor gamma. f Time course of tubule formation using stable EGFP-CaaX background. All images are representative of 12 individual cells within different individual animals. See also Supplementary Movies 1 and 2. Scale bars; (ae) 10 µm, (f) 50 μm.

Ultrastructure of T-tubule development.

af Transverse orientated transmission electron microscope (TEM) sections showing early T-tubules and sarcoplasmic reticulum. a, b Transverse sections through the Z line (Z) at 16 and 48 hpf. Electron dense, ferricyanide stained tubules are denoted by arrows. c, d Equivalent transverse sections taken towards the centre of the sarcomere, some distance from the Z-line. Arrowheads denote sarcoplasmic reticulum, which has an unstained lumen and a beaded appearance. e, f Oblique sections at 5 and 10 dpf show both ferricyanide stained, electron dense tubules (arrows) and sarcoplasmic reticulum (arrowheads). M, M-line, Z, Z-line. See also Supplementary Movie 3 (gi) TEM images were derived from two individual animals per time point and specific observations described were noted in >12 individual cells. Serial blockface electron microscopy and 3D reconstruction shows association of T-tubules with myofibril furrows or splits at level of the Z-line (see also Supplementary Movie 3). Images are derived from two individual animals and images shown are representative of both (j) Single planes from a focussed ion beam volume enables precise measurements of tubule morphometrics (quantitative data are shown in Fig. 3g). This analysis is derived from one individual. k Tracing of TEM images illustrates the architecture of myofibril furrows and associated tubules. Red, tubules/furrows; pink, myofibrils; green, sarcolemma. Full masks are shown in Fig. 3a–c. These analyses are derived from one individual per time point. Scale bars; (af) 1 µm, (g, h) 10 µm, (j) 200 nm, (k) 10 µm.

Mathematical model of T-tubule development.

ac Tracing of tiled TEM montages allows extraction of quantitative data. d Relationship between fibre cross-sectional area and myofibril cross-sectional area. e Relationship of myofibril cross-sectional area to linear furrow distance. f Somite width during the first 10 days post fertilisation n > 25 per time point. g Precise measurements from focussed ion beam volumes shows that T-tubules are elliptical (see also Fig. 2j) n = 17 tubules in one fish. h, i Application of the model for sarcolemmal and T-tubule surface area for muscle fibre sizes up to 40 µm diameter × 580 µm length. This was the maximum measured from a single 1 year old adult male. Dotted line shows the intersect of the two planes. Scale bar; (ac) 50 µm.

Sarcomere formation and sarcoplasmic reticulum.

a, b Lifeact (marks actin). See also Supplementary Movie 4. c, d KDEL (marks endoplasmic/sarcoplasmic reticulum). esmyhc1/ embryos show intact tubules with reduced but regular spacing in slow muscle fibres. ftitin/ embryos show dysregulated tubule structure. g Quantification of inter T-tubule distance in fast and slow fibres from smyhc1/ mutant embryos. Fast fibres n = 25, slow fibres n = 17 biologically independent animals, one cell per animal over one independent experiment. Two-tailed T-test. Error bars show mean ± SD. **** p < 0.0001. h Transverse TEM section showing WT tubules (arrows). i, j Transverse TEM sections from titin/ mutants showing difference in morphology between tubules associated with sarcoplasmic reticulum (arrows) and tubules not associated with sarcoplasmic reticulum (arrowheads). k Quantification of sarcoplasmic reticulum associated and non-associated tubules in titin/ mutant embryos. WT n = 42, ttn/ +SR n = 22, ttn/ −SR n = 19 tubules from two biologically independent animals per group, over one independent experiment. One-way ANOVA followed by Tukey’s multiple comparison test. Error bars show mean ± SD. ****p < 0.0001. (a, c) 24 hpf; (b, d, f, k), 48 hpf (e g, h, i, j), 72 hpf. Scale bars (af) 5 µm, (hj) 1 µm. All images are representative of 12 individual cells within different individual animals.

Tubules are stabilised by endocytic capture.

ac Different tubule morphologies by confocal microscopy (EGFP-CaaX, inverted). a Longitudinal elements are frequently seen between forming tubules (arrows) and additional elements appear to connect to the sarcolemma (arrowheads). b Glancing optical sections across the sarcolemma at 16 hpf immediately before stabilised transverse orientated tubules become visible, show CaaX-positive tubules directly beneath. c At 48 hpf putative surface-connected elements (arrows) are frequently seen in glancing optical sections across the sarcolemma. Images are representative of 12 individual cells within different individual animals. df Intramuscular injection of Alexa-647 conjugated UTP into EGFP-CaaX fish results in immediate infiltration into the developing T-system. (d) 16 hpf, (e) 24 hpf, (f) 48 hpf. Images are representative of three different individual animals. g Timelapse microscopy of 10,000 MW-dextran-Alexa-647 injected EGFP-CaaX fish shows immediate infiltration into the tubules, and uptake into intracellular vesicles within 10 min (see also Supplementary Movie 5). Images are representative of three different individual animals. h Serial blockface electron microscopy and 3D reconstruction shows tubules connecting stabilised, sarcomere associated tubules to the sarcolemma. Images were derived from two individual animals and images shown are representative of both. See also Supplementary Fig. 5a. Individual Z planes are shown in h1h6. Scale bars; (ac) 5 µm, (df) 10 µm, (g, h) 5 µm.

Composition of early T-tubules.

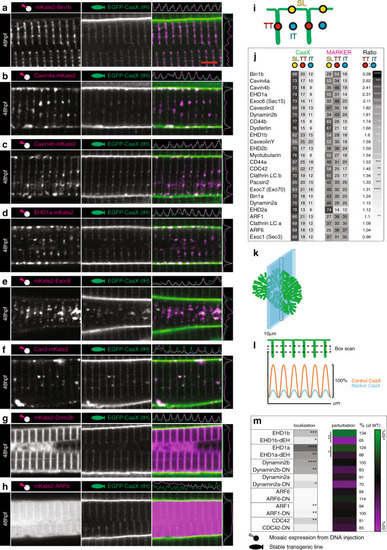
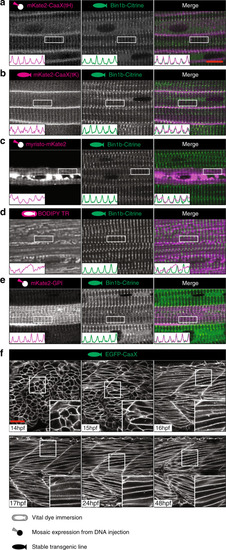
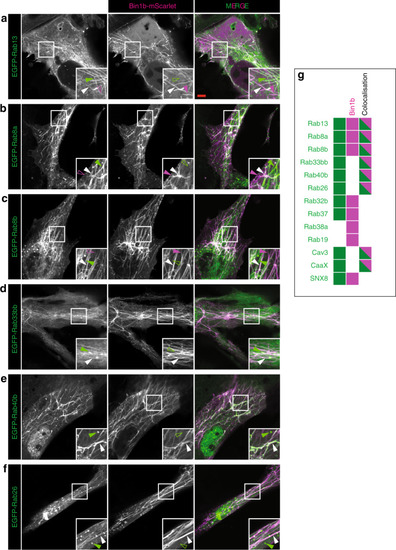
Images of the top seven markers for T-tubule localisation, compared to a non-tubule marker (ARF6). a Bin1b. b Cavin4a. c Cavin4b. d EHD1a. e Exoc6. f Caveolin3. g Dynamin2b. h ARF6. Scale bar, 5 µm. i Schematic showing domains used for localisation analysis. TT, T-tubule domain; SL, sarcolemma; IT, inter-tubule domain. j Markers ranked for T-tubule localisation. k Schematic showing the information captured by lateral optical sectioning of T-tubules by confocal microscopy. The average diameter of the T-tubules in the transverse plane was 96 nm when measured precisely by electron microscopy. However these structures can appear to be up as large as 380 nm in the xy plane of confocal microscope images due to light scatter and can increase to 800 nm in the z-plane. In this schematic, the T-tubules are scaled to a 380 nm diameter, and the optical section is scaled to 800 nm. l Schematic showing analysis strategy for assessment of perturbation. A boxed region of interest was placed over an array of eight T-tubules to give the average pixel intensity in the y dimension. This method ensured that quantitative assessment of signal was possible even where T-tubules were fragmented or only partially present. For each sample, amplitude was expressed as a percentage of the wildtype (non-expressing) cell from within the same image. m Comparison of wildtype and dominant negative variants for proteins amenable to such changes. For perturbation and localisation, n = 6 fibres per marker, each from individual biologically independent animals per condition, measured over one independent experiment. Two-tailed T-test. *p < 0.05, **p < 0.01, ***p < 0.001, ****p < 0.0001. Exact p values are given in source data. All images are representative of 12 individual cells within different individual animals.

Phosphoinositide signature of early T-tubules.

a LactC2 probe for phosphatidylserine (PS). b BTK probe for PtdIns(3,4,5)P2. c PLC-D probe for PtdIns(4,5)P2. d ING probe for PtdIns(5)P. e FAPP1 probe for PtdIns(4)P. f ATG18 probe for PtdIns (3,5)P2. g 2xFYVEhrs probe for PtdIns(3)P. h Ranked heatmap comparing average pixel intensity across each domain (T-tubule, sarcolemma and inter-T-tubule domain), for markers of interest and EGFP-CaaX. n = 6 fibres per marker, each from individual biologically independent animals per condition, measured over one independent experiment. Two-tailed T-test. *p < 0.05, **p < 0.01, ***p < 0.001, ****p < 0.0001. Exact p values are given in source data. Scale bars, 5 µm. All images are representative of 12 individual cells within different individual animals.

An overexpression screen of Rab proteins.

ae Top five hits for T-tubule localisation. a Rab33bb. b Rab32b. c Rab40b. d Rab13. e Rab37. fh Top three hits for perturbation of fluorescence amplitude. f Rab6a. g Rab23. h Rab4a. i Ranked heatmap showing specific localisation to the T-tubule domain, and the capacity of Rab overexpression to perturb T-tubule formation. n = 6 fibres per marker, each from individual biologically independent animals per condition, measured over one independent experiment. Two-tailed T-test. *p < 0.05, **p < 0.01, ***p < 0.001, ****p < 0.0001. Exact p values are given in source data. Scale bars, 5 µm. See also Supplementary Fig. 8. All images are representative of 12 individual cells within different individual animals.

An in vitro model of T-tubule formation.

(a) Rab13, (b) Rab8a, (c) Rab8b, (d) Rab33bb, (e) Rab40b, (f) Rab26, (g) summary graphic showing cells that possess tubules with Bin1b only (magenta), marker only (green) and tubules where bin1b colocalizes with the marker (dual colour; (see also Supplementary Fig. 9). Images are representative of three individual cells imaged within the same experiment.

Acknowledgments
This image is the copyrighted work of the attributed author or publisher, and ZFIN has permission only to display this image to its users. Additional permissions should be obtained from the applicable author or publisher of the image. Full text @ Nat. Commun.