|
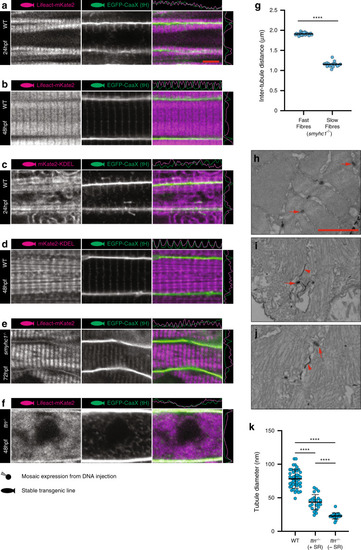
Sarcomere formation and sarcoplasmic reticulum.a, b Lifeact (marks actin). See also Supplementary Movie 4. c, d KDEL (marks endoplasmic/sarcoplasmic reticulum). esmyhc1−/− embryos show intact tubules with reduced but regular spacing in slow muscle fibres. ftitin−/− embryos show dysregulated tubule structure. g Quantification of inter T-tubule distance in fast and slow fibres from smyhc1−/− mutant embryos. Fast fibres n = 25, slow fibres n = 17 biologically independent animals, one cell per animal over one independent experiment. Two-tailed T-test. Error bars show mean ± SD. **** p < 0.0001. h Transverse TEM section showing WT tubules (arrows). i, j Transverse TEM sections from titin−/− mutants showing difference in morphology between tubules associated with sarcoplasmic reticulum (arrows) and tubules not associated with sarcoplasmic reticulum (arrowheads). k Quantification of sarcoplasmic reticulum associated and non-associated tubules in titin−/− mutant embryos. WT n = 42, ttn−/− +SR n = 22, ttn−/− −SR n = 19 tubules from two biologically independent animals per group, over one independent experiment. One-way ANOVA followed by Tukey’s multiple comparison test. Error bars show mean ± SD. ****p < 0.0001. (a, c) 24 hpf; (b, d, f, k), 48 hpf (e g, h, i, j), 72 hpf. Scale bars (a–f) 5 µm, (h–j) 1 µm. All images are representative of 12 individual cells within different individual animals.
|