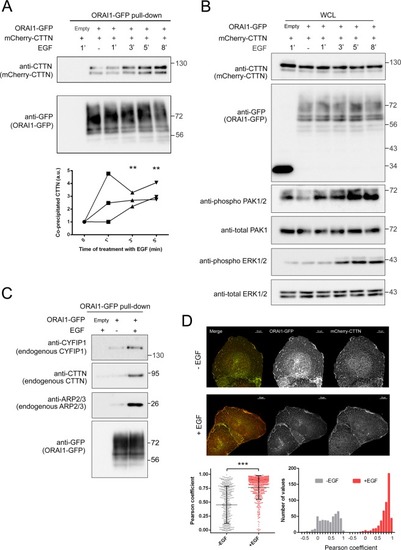
EGF potentiated ORAI1 binding to CTTN, CYFIP1, and ARP2/3. Panel A: U2OS cells transfected for the expression of ORAI1-GFP (or the empty vector, i.e., GFP only) and mCherry-CTTN were starved overnight with FBS-free medium and treated with 50 ng/ml EGF for the times indicated in the figure. Images are representative of 3 independent experiments. From total lysates, ORAI1-GFP was pulled down and the co-precipitated mCherry-CTTN analyzed by immunoblot. In co-IP assays, proteins were separated using 6.5% acrylamide gels. Total ORAI1-GFP pulled down was assessed with an anti-GFP antibody. The quantification of ORAI1-CTTN co-precipitation was evaluated with an anti-CTTN antibody from 3 independent experiments (scatter plot). Panel B: Whole cell lysates (WCL) from panel A were subjected to electrophoresis on 10% acrylamide gels, blotted, and assessed for the level of mCherry-CTTN, ORAI1-GFP, phospho-PAK1/2, total-PAK1, phospho-ERK1/2, and total-ERK1/2. Panel C: U2OS cells were transfected for the expression of ORAI1-GFP or the empty vector. Cells were starved overnight with FBS-free medium and treated with 50 ng/ml EGF for 3 min. ORAI1-GFP was pulled down, and the co-precipitated endogenous CYFIP1, CTTN, and ARP2/3 were analyzed by immunoblot. Total ORAI1-GFP pulled down was assessed with an anti-GFP antibody. Blots are representative of 3 independent experiments. Full-length blots are presented in Supplementary Fig. S13. Panel D: U2OS cells transfected for the expression of ORAI1-GFP and mCherry-CTTN were starved overnight with FBS-free medium and treated with 50 ng/ml EGF for 3 min (+EGF). Controls without the addition of EGF (-EGF) were processed in parallel. Fixed cells were analyzed under epifluorescence microscopy to evaluate the Pearson correlation coefficient of GFP and mCherry in the cell periphery only. Circular ROIs of 1.1–1.18 μm2 were set over the cell periphery that remained free of cell-cell contacts. Pearson correlation coefficient values within the range 0–1 are plotted in the bottom left panel. Right panel shows the histogram of the frequency distribution of Pearson coefficient values.
|
