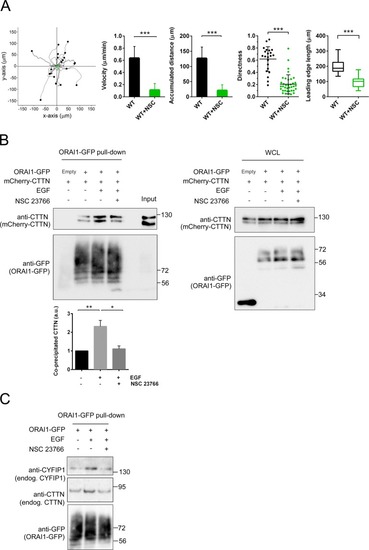
Inhibition of RAC1 impaired cell motility and reduced co-precipitation of ORAI1 with markers of the leading edge. Panel A: Tracking of U2OS cells (black symbols) and cells treated with NSC 23766 (green symbols) in a 2D random motility assay. Representative traces per condition are shown (20–21 per condition). The cells were monitored for speed, accumulated distance, and directness. The data in the panels are from 2 independent assays per condition and a minimum of 36 cells per condition. The leading edge length was measured using bright-field images of wild-type live cells growing in collagen-coated culture dishes. When required, cells were incubated with NSC 23766 for 8 h before the analysis. A minimum of 37 cells from 3 independent experiments were measured. Panel B: U2OS cells were transfected for the expression of ORAI1-GFP (or the empty vector) and mCherry-CTTN. Cells were starved overnight with FBS-free medium and treated with 50 ng/ml EGF for 3 min. Treatment with NSC 23766 was performed as indicated in the Fig. 6. ORA1-GFP was pulled down, and the co-precipitated mCherry-CTTN analyzed by immunoblot. Total ORAI1-GFP pulled down was assessed with an anti-GFP antibody. The quantification of ORAI1-CTTN co-precipitation was evaluated with an anti-CTTN antibody from 3 independent experiments. Whole cell lysates (WCL) were assessed for the level of mCherry-CTTN and ORAI1-GFP as the experimental control. Blots are representative of 3 independent experiments. Panel C: Cells were transfected for the expression of ORAI1-GFP and treated with EGF or NSC 23766 as indicated above. ORAI1-GFP was pulled down and the level of co-precipitated endogenous CYFIP1 and CTTN was analyzed by immunoblot. ORAI1-GFP pulled down was analyzed with an anti-GFP antibody. Blots are representative of 3 independent experiments. Full-length blots are presented in Supplementary Fig. S13.
|
