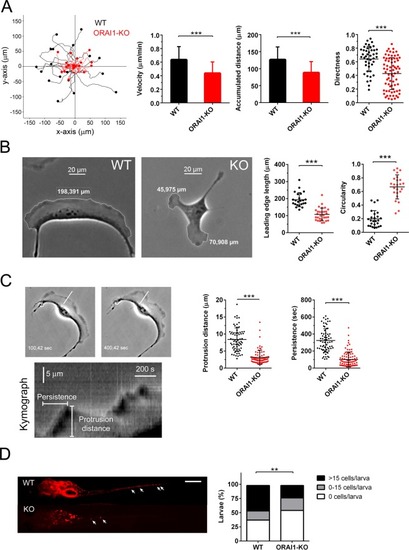
Genetic ablation of ORAI1 reduced motility, directness, lamellipodia formation, and invasion of U2OS cells. Panel A: Wild-type U2OS cells (black symbols) and ORAI1-KO cells (red symbols) were monitored for speed, accumulated distance, and directness in a 2D random motility assay (total assay time = 200 min). Representative traces of 19 cells/condition are shown in the left figure. Data from 3 independent assays/condition (n = 44 WT cells; n = 78 KO cells) are shown as bar charts or dot plot. Panel B: The leading edge length was measured using bright-field images of wild-type cells and ORAI1-KO cells. Data from 3 independent experiments (>22 cells/condition) were measured. Bar = 20 μm. Circularity index was measured from 2 independent experiments (>20 cells/condition). Panel C: Protrusion distance and persistence were measured from 2D random motility assays. Using a 3-pixel width line drawn at the leading edge, protrusion distance and persistence were measured from the resulting kymograph (left panels). An example of a wild-type cell at two different times and the resulting kymograph are shown. Plotted data are individual data from 2 independent experiments. Panel D: The experimental design of xenotransplants of wild-type U2OS and ORAI1-deficient cells in casper zebrafish larvae is represented in the Supplementary Fig. S5. Imaging to analyze U2OS cells invasion was performed at 5 days post injection (dpi). Left panels: Representative images of wild-type and ORAI1-KO U2OS cells dissemination in zebrafish at 5 dpi. Magnification bar: 500 µm. Right panel: Percentage of invaded larvae of both genotypes with different invasion levels. Data shown in bar chart are from 2 independent experiments (n = 119 larvae injected with WT cells, n = 87 larvae injected with ORAI1-KO cells). **p < 0.01 according to Chi-square tests.
|
