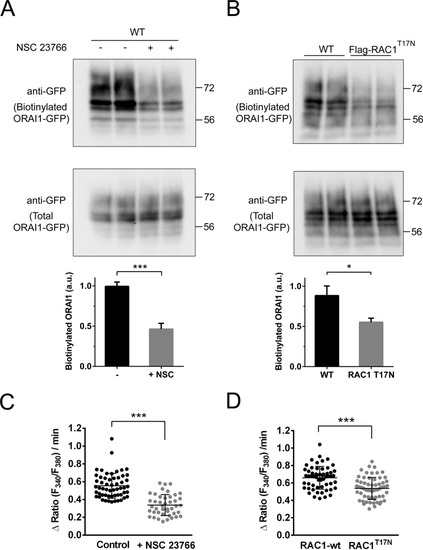
Inhibition of RAC1 reduced surface ORAI1 and SOCE. Panel A: U2OS cells were transfected for the expression of ORAI1-GFP and cultured with FBS-containing DMEM. NSC 23766 was added to the culture medium 8 h before the biotinylation assay, when required. Cells were assessed for the level of ORAI1-GFP at the cell surface by a biotinylation assay of proteins at the plasma membrane in live intact cells and subsequent analysis of biotinylated ORAI1-GFP (top panel). Whole cell lysates were analyzed to assess the total amount of ORAI1-GFP (bottom panel). Quantification of results from 2 independent experiments is shown as a bar chart. Panel B: Wild-type U2OS cells or cells overexpressing Flag-RAC1T17N were assessed for the level of ORAI1-GFP at the plasma membrane, as in panel A. Quantification of results from 2 independent experiments is shown as bar chart. Full-length blots are presented in Supplementary Fig. S13. Panels C-D: Cells were loaded with fura-2-AM and treated with 1 μM thapsigargin in Ca2+-free Hank’s balanced salt solution. Then, 2 mM CaCl2 was added to this assay medium, and the increase rate of the ratio F340/F380 was measured during the first 90 sec after the addition of Ca2+. Results from 2 independent experiments are shown as a scatter plot.
|
