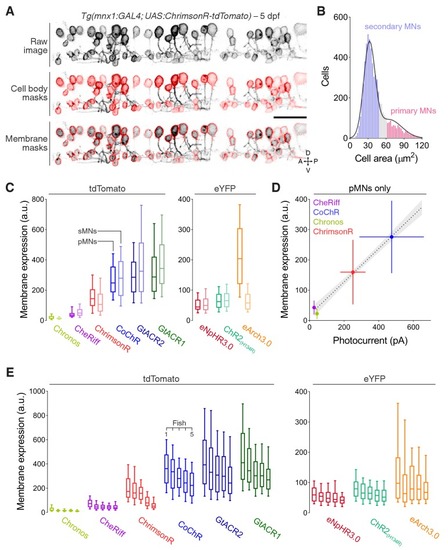
Figure 1—figure supplement 1.

Analysis of opsin expression in larval motor neurons.

(A) Opsin expression in spinal motor neurons in a Tg(mnx1:GAL4;UAS:ChrimsonR-tdTomato) larva at 5 dpf. Middle panel shows masks used to compute cell body area. Bottom panel shows masks used to estimate membrane expression. A, anterior; D, dorsal; P, posterior; V, ventral. Scale bar 30 μm. (B) Cell body area and dorsoventral location in the spinal cord were used to classify cells as primary or secondary motor neurons (MNs) (Menelaou and McLean, 2012). Black line corresponds to sum of two Gaussians fit. Grey bars indicate unclassified neurons. (C) Opsin expression estimated as mean fluorescence intensity per membrane pixel in primary MNs (pMNs, dark) and secondary MNs (sMN, light). Opsins are grouped according to the fluorescent protein they are linked to. Box plots range from 10th to 90th percentiles. a. u., arbitrary units. (D) Opsin expression in pMNs vs. photocurrents in pMNs for cation channelrhodopsins linked to tdTomato. Error bars indicate standard deviation. Dotted line and grey areas correspond to linear fit with 95% confidence intervals. (E) Opsin expression across all neurons in individual fish (N = 5 larvae per opsin; Chronos, n = 302 cells; CheRiff, n = 998; ChrimsonR, n = 771; CoChR, n = 514; GtACR2, n = 1002; GtACR1, n = 735; eNpHR3.0, n = 386; ChR2(H134R), n = 910; eArch3.0, n = 487).

Expression Data

Expression Detail
Antibody Labeling
Phenotype Data

Phenotype Detail
Acknowledgments
This image is the copyrighted work of the attributed author or publisher, and ZFIN has permission only to display this image to its users. Additional permissions should be obtained from the applicable author or publisher of the image. Full text @ Elife