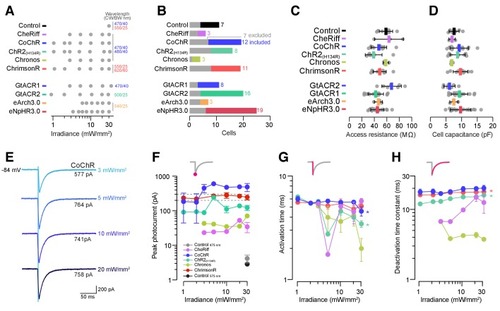
Figure 4—figure supplement 1.
- ID
- ZDB-FIG-200424-15
- Publication
- Antinucci et al., 2020 - A calibrated optogenetic toolbox of stable zebrafish opsin lines
- Other Figures
-
- Figure 1
- Figure 1—figure supplement 1.
- Figure 2
- Figure 2—figure supplement 1.
- Figure 2—figure supplement 2.
- Figure 3
- Figure 3—figure supplement 1.
- Figure 4
- Figure 4—figure supplement 1.
- Figure 5—figure supplement 1.
- Figure 5.
- Figure 6
- Figure 6—figure supplement 1.
- Figure 6—figure supplement 2.
- Figure 7
- Figure 7—figure supplement 1.
- Figure 7—figure supplement 2.
- Figure 7—figure supplement 3.
- Figure 7—figure supplement 4.
- Figure 8—figure supplement 1.
- Figure 8.
- Figure 9—figure supplement 1.
- Figure 9.
- Figure 10.
- All Figure Page
- Back to All Figure Page
|
( |

