
Figure 5.
- ID
- ZDB-FIG-200424-16
- Publication
- Antinucci et al., 2020 - A calibrated optogenetic toolbox of stable zebrafish opsin lines
- Other Figures
-
- Figure 1
- Figure 1—figure supplement 1.
- Figure 2
- Figure 2—figure supplement 1.
- Figure 2—figure supplement 2.
- Figure 3
- Figure 3—figure supplement 1.
- Figure 4
- Figure 4—figure supplement 1.
- Figure 5—figure supplement 1.
- Figure 5.
- Figure 6
- Figure 6—figure supplement 1.
- Figure 6—figure supplement 2.
- Figure 7
- Figure 7—figure supplement 1.
- Figure 7—figure supplement 2.
- Figure 7—figure supplement 3.
- Figure 7—figure supplement 4.
- Figure 8—figure supplement 1.
- Figure 8.
- Figure 9—figure supplement 1.
- Figure 9.
- Figure 10.
- All Figure Page
- Back to All Figure Page
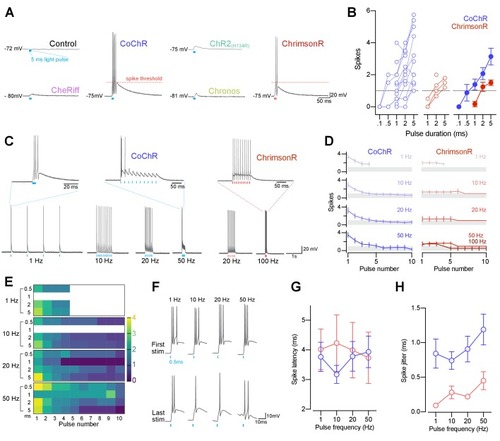
CoChR and ChrimsonR can elicit spiking in primary motor neurons. (A) Example membrane depolarisations induced by 5 ms light pulses (20 mW/mm2). (B) Number of optogenetically-evoked spikes vs. pulse duration (across irradiance levels 1–30 mW/mm2). Longer pulse duration induced more spikes in both CoChR- and ChrimsonR-expressing cells. Left plots show single neurons and right plot shows mean ± SEM across cells. (C) Example voltage responses from CoChR- and ChrimsonR-expressing cells upon pulse train stimulation (1–100 Hz, 2–5 ms pulse duration). (D) Number of spikes vs. pulse number within a train (mean ± SEM, across cells; shaded area depicts average number of spikes is below 1). In CoChR-expressing cells, the initial 3–4 pulses within the train induced bursts of 2–4 spikes. (E) Heatmap of mean spike number elicited via CoChR stimulation, separated according to stimulation frequency and pulse duration. Primary motor neurons often responded with bursts of action potentials, even for short light pulses. (F) Example responses to the 1st (top) and last (bottom) 0.5 ms light pulse in a train, recorded from a CoChR-positive neuron. (G) Spike latency vs. pulse frequency (mean ± SEM). (H) Spike jitter (mean ± SEM) vs. pulse frequency shows that ChrimsonR-expressing cells exhibited lower spike jitter than CoChR-expressing cells. See also Figure 5—figure supplement 1. |