
Figure 6
- ID
- ZDB-FIG-200424-18
- Publication
- Antinucci et al., 2020 - A calibrated optogenetic toolbox of stable zebrafish opsin lines
- Other Figures
-
- Figure 1
- Figure 1—figure supplement 1.
- Figure 2
- Figure 2—figure supplement 1.
- Figure 2—figure supplement 2.
- Figure 3
- Figure 3—figure supplement 1.
- Figure 4
- Figure 4—figure supplement 1.
- Figure 5—figure supplement 1.
- Figure 5.
- Figure 6
- Figure 6—figure supplement 1.
- Figure 6—figure supplement 2.
- Figure 7
- Figure 7—figure supplement 1.
- Figure 7—figure supplement 2.
- Figure 7—figure supplement 3.
- Figure 7—figure supplement 4.
- Figure 8—figure supplement 1.
- Figure 8.
- Figure 9—figure supplement 1.
- Figure 9.
- Figure 10.
- All Figure Page
- Back to All Figure Page
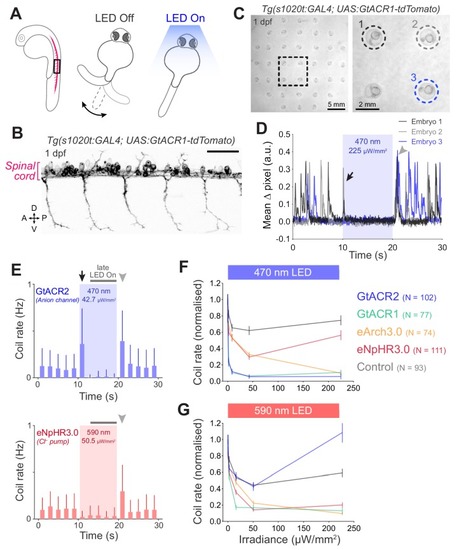
(A) Schematic of the behavioural assay. (B) Opsin expression in spinal motor neurons and interneurons in a Tg(s1020t:GAL4;UAS:GtACR1-tdTomato) embryo at 1 dpf. Imaging field of view corresponds to black box in (A). A, anterior; D, dorsal; P, posterior; V, ventral. Scale bar 50 μm. (C) Camera field of view showing Tg(s1020t:GAL4;UAS:GtACR1-tdTomato) embryos positioned in individual agarose wells. Behaviour was monitored at 50 frames per second across multiple embryos (24–27 hpf; N = 91 ± 16 fish per group, mean ± SD) subjected to 10 s light periods (470 or 590 nm, 0–227 μW/mm2) with a 50 s inter-stimulus interval. (D) Tracking of coiling behaviour (mean ΔPixel from three trials) for the three embryos shown in (C). Black arrow indicates movements at light onset, whereas grey arrowhead indicates synchronised restart of coiling behaviour following light offset. (E) Optogenetically-induced changes in coil rate (mean + SD, across fish) in embryos expressing the anion channelrhodopsin GtACR1 (N = 77 embryos, top) or the Cl– pump eNpHR3.0 (N = 111 embryos, bottom). Horizontal dark grey bars indicate the’ late LED On’ period. Each time bin corresponds to 2 s. (F,G) Normalised coil rate during the’ late LED On’ period in embryos expressing different opsins (mean ± SEM, across fish). Control opsin-negative siblings were subjected to the same light stimuli. See also Figure 6—figure supplements 1 and 2 and Figure 6—video 1. |