FIGURE

Figure 6

ID
ZDB-FIG-200423-53
Publication
Gong et al., 2020 - The Requirement of Sox2 for the Spinal Cord Motor Neuron Development of Zebrafish
Other Figures
All Figure Page
Back to All Figure Page
Figure 6

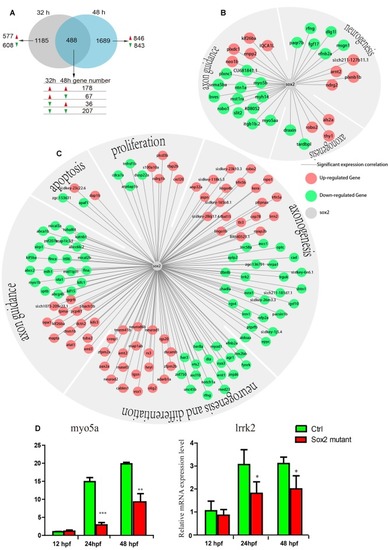
The results of transcriptomic profiling in Sox2 mutant and wild-type zebrafish. (A) The Venn chart in the control and Sox2 knockout treatment group. Differently continuous change types are displayed, red/green arrow means a gene up-/down-regulation at the time point. The expression correlation between Sox2 and differentially expressed genes (DEGs) at 32 h (B) and 48 h (C); in the networks, the green node represents down-regulated DEGs and the red node represents up-regulated DEGs; moreover, all the DEGs were classified into different groups based on biological function. (D) Effects of Sox2 deficiency on the expressions of two motor neuron regulation-related genes. Experimental embryos were sampled at 12, 24, and 48 hpf (n = 12). Each bar represents the mean ± SD. Values with *, ** and *** above the bars are significantly different (P < 0.05, P < 0.01 and P < 0.001, respectively).

Expression Data
Gene:
Fish:
Anatomical Terms:
Stage Range: Long-pec to Protruding-mouth

Expression Detail
Antibody Labeling
Phenotype Data

Phenotype Detail
Acknowledgments
This image is the copyrighted work of the attributed author or publisher, and ZFIN has permission only to display this image to its users. Additional permissions should be obtained from the applicable author or publisher of the image. Full text @ Front. Mol. Neurosci.