
Fig. 6
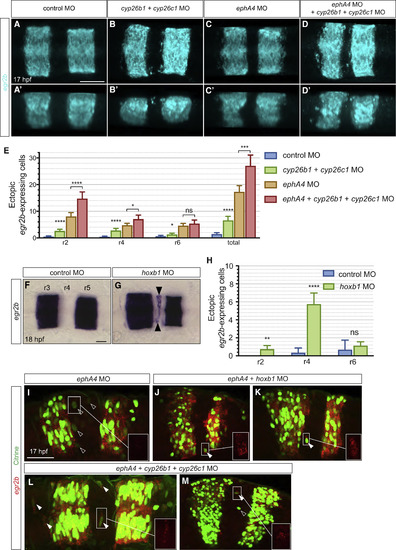
cyp26b1, cyp26c1, and hoxb1 Knockdown Increases Ectopic egr2-Expressing Cells (A–D) egr2b expression in 17 hpf embryos in which cyp26b1 and cyp26c1 were knocked down, compared with control morphants. Dorsal (A–D) and lateral (A′–D′) maximum intensity projections are shown. Knockdown of cyp26b1 and cyp26c1 causes an increased number of egr2b-expressing cells in r2, r4 and r6 (B and B′) compared with control embryos (A and A′); see also Figure S3. Combined knockdown of cyp26b1, cyp26c1, and ephA4 increases the number of egr2b expressing cells in r2 and r4 (D and D′) compared with ephA4 morphant embryos (C and C′) and cyp26b1 plus cyp26c1 knockdown alone (B and B′). (E) Mean number of egr2b-expressing cells in even-numbered segments with 95% confidence intervals. Since blocking identity switching will favor segregation of cells that have initially intermingled, we counted egr2-expressing cells adjacent to r3 and r5 as well as isolated cells. Asterisks indicate statistical significance determined by Welsh's t test. For cyp26b1 and cyp26c1 morphants (n = 40) compared with control morphants (n = 22): r2, p < 0.0001; r4, p < 0.0001; r6, p = 0.038; all misplaced egr2b-expressing cells, p < 0.0001. For ephA4, cyp26b1, and cyp26c1 triple morphants (n = 21) compared with ephA4 morphants (n = 33): r2, p < 0.0001; r4, p = 0.01; r6, p = 0.31; total, p = 0.0001. (F–H) Knockdown of hoxb1a and hoxb1b (hoxb1 MO) increases the number of egr2b-expressing cells in r4 (black arrowheads) at 18 hpf (G) compared with control embryos (F). hoxb1 knockdown does not affect cyp26b1 or cyp26c1 expression (Figure S4). (H) Mean number of ectopic egr2b-expressing cells with 95% confidence intervals. Asterisks indicate statistical significance determined by Welsh's t test: r2, p = 0.001; r4, p < 0.0001; r6, p = 0.38. Control embryos, n = 6; hoxb1 morphants, n = 26. (I–M) Knockdowns in the egr2b:H2B-Citrine line followed by detection of Citrine protein with anti-GFP antibody (green) and egr2b transcripts (red). The box in the bottom right of each panel is a magnified view of the egr2b transcript signal in the indicated area. Following knockdown of ephA4 alone to increase cell intermingling, ectopic Citrine-expressing cells do not express detectable egr2b transcripts (I). egr2b transcripts are detected in ectopic Citrine-expressing cells when ephA4 knockdown is combined with hoxb1 (J and K) or cyp26b1 plus cyp26c1 knockdown (L and M). Empty arrowheads indicate Citrine-expressing cells lacking detectable egr2b transcripts, and filled arrowheads Citrine-expressing cells that express egr2b transcripts. Scale bars: 50 μm. |
Reprinted from Developmental Cell, 45, Addison, M., Xu, Q., Cayuso, J., Wilkinson, D.G., Cell Identity Switching Regulated by Retinoic Acid Signaling Maintains Homogeneous Segments in the Hindbrain, 606-620.e3, Copyright (2018) with permission from Elsevier. Full text @ Dev. Cell