Fig. 3
- ID
- ZDB-FIG-180208-24
- Publication
- Benjamin et al., 2017 - Intravital imaging of metastasis in adult Zebrafish
- Other Figures
- All Figure Page
- Back to All Figure Page
|
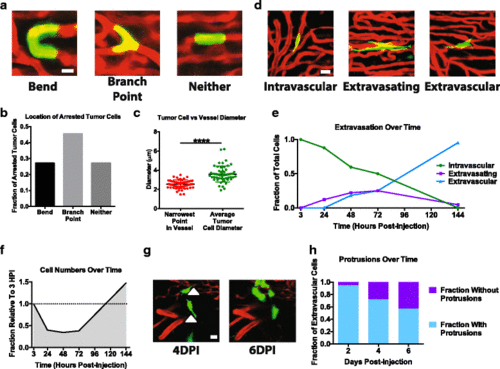
Imaging the early events at the metastatic site. a Example images of ZMEL1 zebrafish melanoma cells arrested at bends, branch points, or neither within 3 h of injection into casper;flk:dsRed fish. Scale bar is 10 μm. b Quantification of the fraction of ZMEL1 cells arrested at bends, branch points, or neither within three hours of injection. Quantifications are representative of 170 cells in 8 fish. c Quantifications of the diameter of arrested ZMEL1 cells and the diameter of the vessel in which they are arrested within 3 h of injection. n = 53 cell and vessel pairs across 5 different fish. p < 0.0001 using a two-tailed Student’s t test. d Example images of intravascular, extravasating, and extravascular cells 2 days post-injection. Scale bar is 10 μm. f Quantification of the fraction of zebrafish melanoma cells that are intravascular, extravasating, and extravascular. Data are representative of 141 cells imaged across 8 different fish. f Quantification of the fraction of ZMEL1 melanoma cells remaining over time following injection. Data are representative of 58 fields in 10 fish. g Image of ZMEL1 cells 4 and 6 days post-injection showing the loss of protrusions (white arrowheads). Scale bar is 10 μm. h Quantification of the fraction of ZMEL1 cells with protrusions over time. Data are representative of 164 cells in 3 fish |
| Gene: | |
|---|---|
| Fish: | |
| Condition: | |
| Anatomical Term: | |
| Stage: | Adult |

