
- Title
-
Intravital imaging of metastasis in adult Zebrafish
- Authors
- Benjamin, D.C., Hynes, R.O.
- Source
- Full text @ BMC Cancer
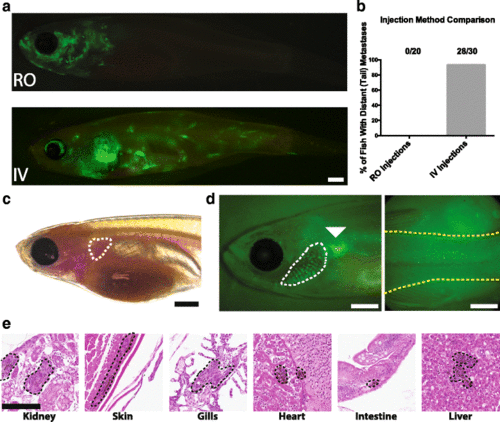
Intravenous injection of zebrafish melanoma cells (ZMEL1) into adult zebrafish. a Representative images of zebrafish injected with GFP-labeled zebrafish ZMEL1 melanoma cells 14 days after retro-orbital (top) and intravenous (bottom) injections. Scale bar is 1 mm. b Quantification of injection efficiency of retro-orbital and intravenous injections as determined by the presence of distant metastases in the posterior of the fish with the success rate indicated. c 6 to 10-week-old casper fish with injection location (common cardinal vein) outlined. Scale bar is 1 mm. d Example of a successful intravenous injection as indicated by GFP-labeled tumor cells in the gills (white dashed line) and posterior of a casper fish (yellow dashed line) 1 h post-injection. The injection site is indicated with a white arrowhead. Scale bar is 1 mm. e H&E stained transverse sections of zebrafish 14 days post-injection showing tumors in the indicated organs. Tumors are indicated by black dotted lines. Scale bar is 100 μm |
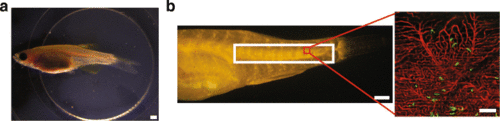
Live imaging of adult zebrafish following injection of ZMEL1 melanoma cells. a Intravital imaging set-up with an adult zebrafish restrained in low-melt agarose in a glass-bottomed 6-well plate. Scale bar is 1 mm. b Region of imaging in the posterior of a casper;flk:dsRed zebrafish (white box) and example of a single 20× confocal field (red box). Scale bar for the posterior is 1 mm. Scale bar for the 20× field is 100 μm EXPRESSION / LABELING:
|
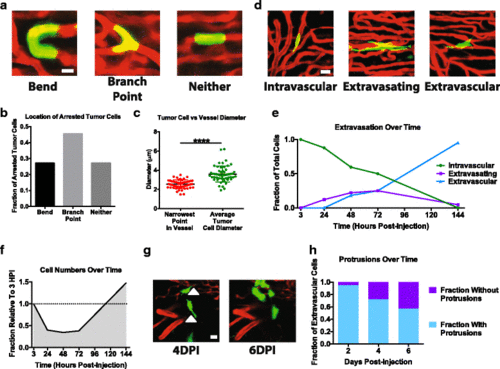
Imaging the early events at the metastatic site. a Example images of ZMEL1 zebrafish melanoma cells arrested at bends, branch points, or neither within 3 h of injection into casper;flk:dsRed fish. Scale bar is 10 μm. b Quantification of the fraction of ZMEL1 cells arrested at bends, branch points, or neither within three hours of injection. Quantifications are representative of 170 cells in 8 fish. c Quantifications of the diameter of arrested ZMEL1 cells and the diameter of the vessel in which they are arrested within 3 h of injection. n = 53 cell and vessel pairs across 5 different fish. p < 0.0001 using a two-tailed Student’s t test. d Example images of intravascular, extravasating, and extravascular cells 2 days post-injection. Scale bar is 10 μm. f Quantification of the fraction of zebrafish melanoma cells that are intravascular, extravasating, and extravascular. Data are representative of 141 cells imaged across 8 different fish. f Quantification of the fraction of ZMEL1 melanoma cells remaining over time following injection. Data are representative of 58 fields in 10 fish. g Image of ZMEL1 cells 4 and 6 days post-injection showing the loss of protrusions (white arrowheads). Scale bar is 10 μm. h Quantification of the fraction of ZMEL1 cells with protrusions over time. Data are representative of 164 cells in 3 fish EXPRESSION / LABELING:
|
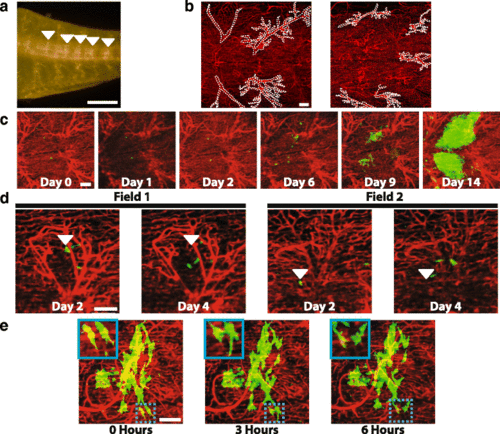
Imaging of disseminated tumor cells over the course of two weeks. a Image of the tail of a flk:dsRed;casper fish with the large vessels used as landmarks indicated by white arrowheads. Scale bar is 1 mm. b Example 10× fields with the large vessels used for landmarks (white dotted lines) highlighted to indicate that the vessels in each field are unique. Scale bar is 100 μm. c One field containing ZMEL1 tumor cells imaged over the course of two weeks showing the growth pattern of metastases. Scale bar is 100 μm. d Images of two sites on day 2 and day 4 post-injection showing that individual cells are rarely found in the same location during this time period. Arrowheads indicate the position of selected cells 2 days post-injection. Scale bar is 100 μm. e One field 9 days post-injection that was imaged over the course of 6 h showing cells extending and retracting protrusions. Inset shows higher magnification of two cells that change shape extensively during the 6 h of imaging. Scale bar is 100 μm EXPRESSION / LABELING:
|
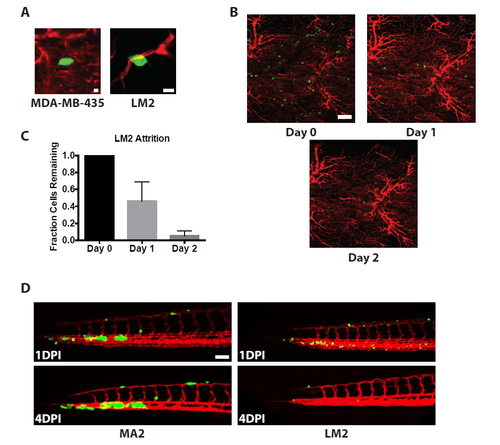
Human tumor cells arrest and extravasate in adult zebrafish but fail to form tumors. (A) Images of human melanoma (MDA-MB-435) and breast cancer (LM2) cells that have extravasated in zebrafish 2 days post-injection. Scale bars are 10 μm. (B) Images showing the attrition of LM2 cells over time in adult zebrafish following injection. Scale bar is 100 μm. (C) Quantification of the fraction of LM2 cells remaining over time in adult zebrafish. n = 47 fields in 7 different fish. (D) Images of the tails of embryos 1 and 4 DPI (3 and 6 days old) injected with LM2 or MA2 cells. Scale bar is 100 μm. |