
Fig. S10
- ID
- ZDB-FIG-180126-8
- Publication
- Lickwar et al., 2017 - Genomic dissection of conserved transcriptional regulation in intestinal epithelial cells
- Other Figures
- All Figure Page
- Back to All Figure Page
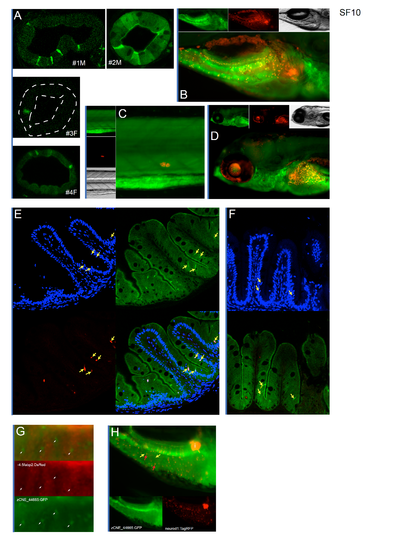
Additional characterization of regulatory capacity of hes1 zCNE_44665 in transgenic zebrafish. A) 7 dpf cross-section of individual transgenic zebrafish lines for hes1 Tg(zCNE_44665:GFP) show consistent GFP expression in a subset of IECs often at the base of nascent folds. B) Minimal gross overlap can be seen between Notch positive cells in the pancreas and the Tg(zCNE_44665:GFP) signal in 7 dpf zebrafish C) The corpusles of Stannius show high Notch positive signaling and little to no GFP expression from Tg(zCNE_44665:GFP). D) Overlap can be seen between Notch positive cells and Tg(zCNE_44665:GFP) signal in the liver. E) and F) Examples of more apical nuclei in 8 week old cross-section in Tg(zCNE_44665:GFP) and Notch positive cells. G) Whole-mount stereoscopic images of 7 dpf Tg(zCNE_44665:GFP)/Tg(-4.5fabp2:DsRed) shows a large proportion of IECs are DsRed+ enterocytes, however a subset of the IECs not expressing DsRed are GFP+ and are marked by white arrows. H) Whole-mount stereoscopic images of 7 dpf Tg(zCNE_44665:GFP)/Tg(neurod1:TagRFP) show lack of overlap between the hes1 Tg(zCNE_44665:GFP) and enteroendocrine cells. Representative GFP+ cells are marked by a yellow arrow and RFP+ cells are marked by a red arrow. Pancreatic islet marked by i. |