
Fig. 6
- ID
- ZDB-FIG-180126-5
- Publication
- Lickwar et al., 2017 - Genomic dissection of conserved transcriptional regulation in intestinal epithelial cells
- Other Figures
- All Figure Page
- Back to All Figure Page
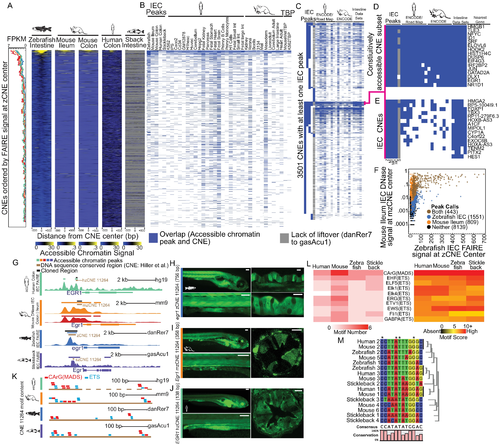
Intestinal epithelial cell (IEC)-specific accessible chromatin at conserved noncoding elements identifies IEC regulatory elements. (A) Conserved nonexonic elements (CNEs) ordered by zebrafish IEC Formaldehyde-Assisted Isolation of Regulatory Elements sequencing (FAIRE-seq) signal at zebrafish conserved nonexonic elements (zCNE) center. (Left) Moving median of Fragments Per Kilobase of transcript per Million mapped reads (FPKM) levels of CNEs nearest gene feature (250 gene window, 1 step; color scheme based on data sets presented in Fig 1A and throughout), showing the relationship between accessible chromatin level and transcription at these conserved regions. (Right) Heat maps of accessible chromatin signals at the 1,000 bp, surrounding the CNE center, highlighting the similarity of signal in IECs at CNEs in all 4 species. Gray represents no mappable signal or failure to liftover to the stickleback genome, as the stickleback genome was not included in the CNE set [55]. (B) Peak overlap of IEC accessible chromatin datasets and human and mouse ENCODE/Roadmap data sets with CNEs in each respective species. Overlap is defined as having at least 1 shared base pair. (C) Cluster analysis of CNEs with at least 1 IEC accessible peak overlap from any of the IEC datasets. (D) Subset of CNEs containing peak overlap from each of the zebrafish, mouse ileum, mouse colon, and human colon IEC datasets, as well as substantial overlap with additional mouse and human data from mostly unrelated tissues. (E) The entire group of CNEs that have overlap with zebrafish intestine, mouse ileum, mouse colon, and human colon but few other data sets, identify potentially highly conserved IEC-specific regulatory elements. (F) Scatterplot of accessible chromatin signal at the center of CNEs for zebrafish IECs and mouse ileum IECs, which shows a positive conserved relationship between accessible chromatin signal at these sites. (G) Accessible chromatin data from the EGR1 locus highlighting the commonly accessible CNE_11264 in multiple species. (H) Whole-mount stereofluorescence of stable transgenic line harboring egr1 Tg(zCNE_11264:GFP) showing highest green fluorescent protein (GFP) expression in IECs in the mid intestine. (Bottom) Close-up view of zebrafish egr1 Tg(zCNE_11264:GFP) intestine. Scale bar 100 μm. (Right) Whole-mount confocal images confirming egr1 Tg(zCNE_11264:GFP) GFP expression in IECs. Scale bar 25 μm. (I) The same as H for stable line Egr1 Tg(mzCNE_11264:GFP). (J) The same as H for stable line EGR1 Tg(hzCNE_11264:GFP). (K) The distribution of CA/T-rich-G (CArG)/MCM1, AGAMOUS, DEFICIENS, and SRF (MADS box) and E26 transformation specific (ETS) motifs in human, mouse, zebrafish, and stickleback CNE_11264 show distinct motif distributions despite sequence conservation. Bronze bar represents conserved region. Dashed bar for human hzCNE_11264 represents the apparently conserved region that is adjacent to the hzCNE_11264 boundary marked with solid bronze bar. (L) Heatmap showing motif number (left) and highest motif score (right) for common motifs detected in CNE_11264. (M) Similarity relationship of CArG boxes detected in CNE_11264 shows the diversity of transcription factor binding sites (TFBS) despite overall sequence conservation. Numbering of CArG box sites is arbitrary. |
| Gene: | |
|---|---|
| Fish: | |
| Anatomical Term: | |
| Stage: | Days 7-13 |