
Fig. 5
- ID
- ZDB-FIG-180126-4
- Publication
- Lickwar et al., 2017 - Genomic dissection of conserved transcriptional regulation in intestinal epithelial cells
- Other Figures
- All Figure Page
- Back to All Figure Page
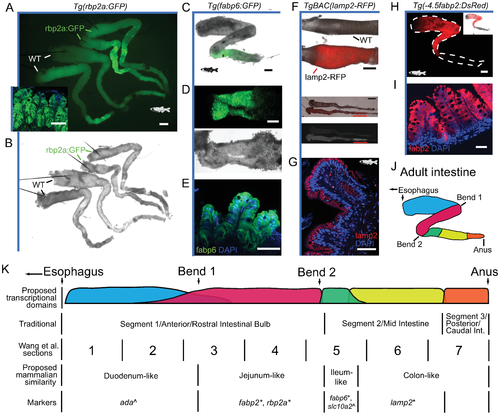
Transcriptional domains identified in larval zebrafish intestine are maintained in adults. (A) Stereomicroscopy image of 2 dissected adult Tg(rbp2a:GFP) intestines (top) and 2 wild-type (WT) intestines without green fluorescent protein (GFP) (bottom) shows high GFP expression between the first and second bend of the adult intestine in Tg(rbp2a:GFP). Autofluorescence can be seen in several intestines following the second bend, presumably due to bile or feces (see brightfield microscopy in B). Scale bar 1,000 μm. Confocal cross-section of adult Tg(rbp2a:GFP) intestinal folds with DAPI in blue shows GFP expression in intestinal epithelial cells (IECs) in the inset panel. Scale bar 50 μm. (B) Brightfield microscopy of 2 dissected adult Tg(rbp2a:GFP) intestines (top) and 2 wild-type intestines (bottom). Dissection pins can be seen as long black lines anchoring the intestine in the intestinal bulb. (C) Stereomicroscopy image of brightfield and GFP overlay for the dissected intestine of adult Tg(fabp6:GFP), showing GFP expression in a discreet domain immediately following the second bend. The anus was excluded in this preparation. Scale bar 1,000 μm. (D) Stereomicroscopy image of GFP (top) and brightfield (bottom) for the dissected adult intestine of Tg(fabp6:GFP) opened lengthwise to show internal detail of the discreet domain of GFP expression. Scale bar 1,000 μm. (E) Confocal cross-section of adult Tg(fabp6:GFP) intestinal folds with DAPI in blue shows high GFP expression in IECs. Scale bar 50 μm. (F) Stereomicroscopy close-up of red fluorescent protein (RFP) and brightfield for adult WT and TgBAC(lamp2-RFP) zebrafish lines (top) showing entire intestines with the segment 2 relative position marked with a red horizontal line (middle). Scale bar 2,000 μm. Fluorescence-only image showing the distribution of the lamp2-RFP signal, highest in segment 2 (bottom). The relative orientation of the WT (top) and TgBAC(lamp2-RFP) (bottom) lines is maintained throughout. (G) Confocal cross-section of adult TgBAC(lamp2-RFP) intestinal folds from segment 2 with DAPI in blue shows high lamp2-RFP expression in IECs. Scale bar 50 μm. (H) (Top) Stereomicroscopy image for a dissected intestine of adult Tg(-4.5fabp2:DsRed) showing DsRed expression most highly between the first and second bend with additional expression in the intestinal bulb. The white dotted line references the dissected intestine. A similar Tg(fabp2:RFP) result has previously been reported [15]. Scale bar 1,000 μm. Overlay between DsRed and brightfield is shown in the inset in the upper right. (I) Confocal cross-section of adult Tg(-4.5fabp2:DsRed) intestinal folds with DAPI in blue shows high DsRed expression in IECs. Scale bar 50 μm. (J) Schematic of dissected adult intestine showing major anatomical features overlaid with proposed transcriptional/functional domains shown in K. (K) Linear schematic representation of proposed transcriptional and functional domains of zebrafish intestine with potential regional gene markers and previously defined regional annotation. Boundaries should not necessarily be considered discrete, and domains may vary or overlap for different genes. Markers refer to proposed region-defining transcriptional markers determined using transgenic lines from this study (*) or from Wang et al. (^)[15]. Additional markers can be inferred from Fig 2 and S3 Fig, including markers for the most posterior region of the zebrafish intestine. |
| Genes: | |
|---|---|
| Fish: | |
| Anatomical Terms: | |
| Stage: | Adult |