
Fig. 7
- ID
- ZDB-FIG-180126-6
- Publication
- Lickwar et al., 2017 - Genomic dissection of conserved transcriptional regulation in intestinal epithelial cells
- Other Figures
- All Figure Page
- Back to All Figure Page
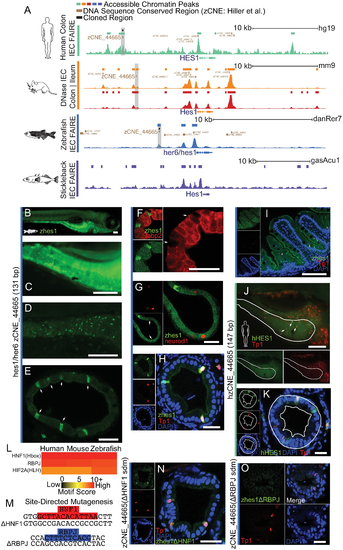
Hes1 conserved nonexonic element (CNE)-driven expression overlaps with Notch signaling and marks a specific population of intestinal epithelial cells (IECs). (A) Accessible chromatin at HES1 loci. (B) Whole-mount stereofluorescence of stable transgenic line 7 dpf zebrafish harboring hes1 Tg(zCNE_44665:GFP) showing green fluorescent protein (GFP) expression in IECs. Scale bar 100 μm. (C) Same as B, a closeup showing high GFP+ IECs in a population of cells. (D) Same as B, a confocal whole-mount z-stack maximum projection of zebrafish intestine showing high GFP+ in a population of IECs. (E) A confocal image of intestinal cross-section of 7 dpf hes1 Tg(zCNE_44665:GFP) showing GFP expression in IECs that appear at the base of slight invaginations (white arrows). Scale bar 25 μm. (F) A confocal intestinal cross-section of 7 dpf zebrafish shows lack of overlap between hes1 Tg(zCNE_44665:GFP) and enterocyte marker Tg(-4.5fabp2:DsRed). GFP+ IECs lacking Discosoma sp. red fluorescent protein (DsRed) are marked with a white arrow. Scale bar 25 μm. (G) Lack of overlap between hes1 Tg(zCNE_44665:GFP) and the enteroendocrine marker Tg(neurod1:TagRFP) [87]. A reduction in background GFP can be seen at red fluorescent protein (RFP)+ cells (white arrow). Scale bar 25 μm. H) A confocal cross-section image shows overlap between hes1 Tg(zCNE_44665:GFP) and Tg(EPV.Tp1-Ocu.Hbb2:hmgb1-mCherry) in 7 dpf zebrafish. Individual channels are shown in inset with DAPI in blue. Scale bar 25 μm. I) A confocal image of cross-section of 8-week-old zebrafish intestinal folds in hes1 Tg(zCNE_44665:GFP) and Tg(EPV.Tp1-Ocu.Hbb2:hmgb1-mCherry). (J) A stereoscopic image showing the overlap of whole-mount human HES1 Tg(hzCNE_44665:GFP) and Tg(EPV.Tp1-Ocu.Hbb2:hmgb1-mCherry) in a subset of IECs in 7 dpf zebrafish. Scale bar 100 μm. (K) A confocal cross-section of 7 dpf zebrafish showing the overlap of human HES1 Tg(hzCNE_44665:GFP) and Tg(EPV.Tp1-Ocu.Hbb2:hmgb1-mCherry). Scale bar 25 μm. (L) Heatmap of common TFBS motifs in CNE_44665 in zebrafish, mouse, and human. (M) A schematic of site-directed mutagenesis on Hepatocyte nuclear factor 1 (HNF1) (top) and Recombination signal binding protein for immunoglobulin kappa J region (RBPJ) (bottom) putative binding sites from zCNE_44665. (N) A confocal whole-mount image showing the overlap between hes1 Tg(zCNE_44665 ΔHNF1 sdm:GFP) and Tg(EPV.Tp1-Ocu.Hbb2:hmgb1-mCherry). Scale bar 25 μm. O) A confocal whole-mount image showing the overlap between hes1 Tg(zCNE_44665 ΔRBPJ sdm:GFP) and Tg(EPV.Tp1-Ocu.Hbb2:hmgb1-mCherry). Scale bar 25 μm. |
| Genes: | |
|---|---|
| Fish: | |
| Anatomical Terms: | |
| Stage Range: | Days 7-13 to Days 45-89 |