
Fig. S6
- ID
- ZDB-FIG-180126-7
- Publication
- Lickwar et al., 2017 - Genomic dissection of conserved transcriptional regulation in intestinal epithelial cells
- Other Figures
- All Figure Page
- Back to All Figure Page
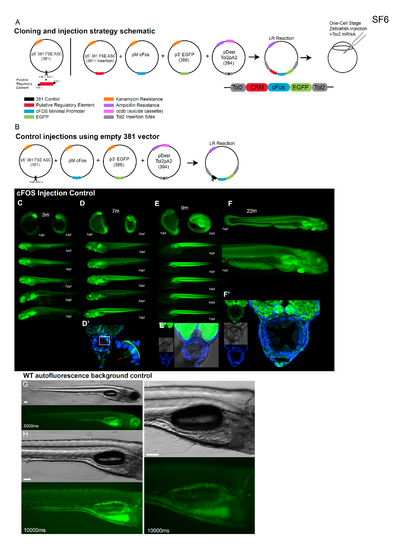
Cloning strategy, cFos injection control, and autofluoresence background. A) Simplified schematic of 4-way LR recombination cloning. Briefly, fragments amplified from a genomic template with primers containing FseI and AscI overhangs are cloned into a 5’ entry vector. A 4-way LR reaction combines the 5' entry containing the putative regulatory element with a middle entry vector containing the minimal cFos promoter (S4 Table) and 3' entry vector with eGFP into a destination vector containing Tol2 insertion sites [125]. B) A cFos control vector was generated to test for potential insertion background expression and the expression capacity of the cFos minimal promoter in IECs as this construct presumably can act as an enhancer trap when inserted into the genome without additional regulatory information. Comprehensive testing of potential insertion influence with this control vector is difficult, however typically no or little expression in IECs was found and none of the cFos control expression fish drove expression patterns that were consistent with the elements tested in the main body of the paper (C-F). While wholemount stereoscopic microscopy of fish containing this control construct did not readily detect IEC GFP expression that we found when testing putative IEC regulatory elements (Figs 4–6). We also performed confocal microscopy on a subset of fish as this is typically more sensitive at identifying localized GFP signal. We note below where limited IEC expression existed in the control lines we profiled, however any IEC expression was not usual and not consistent between control lines. C) Developmental pattern of GFP expression of cFos control line 3m. D) Developmental pattern of GFP expression of cFos control F1 line 7m D’) Cross-section of cFos control line 7m shows light expression in a goblet cell. E) Developmental pattern of GFP expression of cFos control F1 line 9m. E’) Cross-section of cFos control line 9m shows no detectable GFP expression in IECs. F) Developmental pattern of GFP expression of cFos control F1 line 9m. F’) Cross-section of cFos control line 9m shows light GFP expression in IECs. Figures (C-F) are presented on a black background for clarity. Different fish from each line can be represented on different days. Lines 3m shows yolk autofluorescence near the intestine consistent with developmental differences that can disappear variably in developing fish due to environment or genetic background. G-I) Stereomicroscopy images of 7dpf wild-type EK fish without any GFP insertions show the typical autofluoresence signal that can be detected within the intestinal lumen. For each image the number of milliseconds of exposure for the GFP signal is listed. Scale bar 100 μm. |