
Fig. 4
- ID
- ZDB-FIG-180126-3
- Publication
- Lickwar et al., 2017 - Genomic dissection of conserved transcriptional regulation in intestinal epithelial cells
- Other Figures
- All Figure Page
- Back to All Figure Page
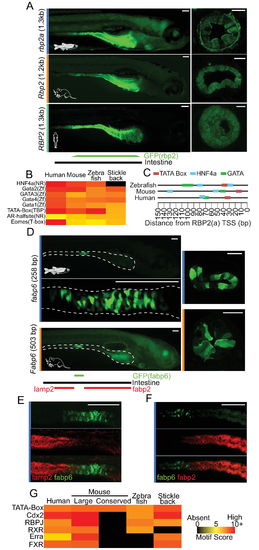
Exogenous regulatory regions identified by intestinal epithelial cell (IEC) accessible chromatin can drive regionally conserved IEC expression in zebrafish larvae. (A) (Left) Whole-mount stereofluorescence images of 7 dpf zebrafish stable lines expressing a green fluorescent protein (GFP) reporter construct for rbp2a/Rbp2/RBP2 accessible regulatory regions from zebrafish, mouse, and human show high levels of expression in IECs in the anterior portion of the intestine. Scale bar 100 μm. (Right) Representative cross-sections of zebrafish intestine confirming high IEC expression for each corresponding stable line. The zebrafish cross-section was taken in the posterior of the intestinal bulb, and the mouse and human cross-sections were taken within the middle of the intestinal bulb. Scale bar 25 μm. (B) Common motifs detected in the RBP2(a) cloned region for each species colored by Homer motif scores. Motif score scale is shared with Figure 4G. (C) Schematic of common transcription factor binding sites (TFBS) motifs found immediately upstream of the transcription start site (TSS) of RBP2(a) in zebrafish, mouse, and human. (D) (Left blue) Whole-mount stereofluorescence images of 7 dpf zebrafish stable line Tg(fabp6:GFP) show high levels of GFP expression in IECs in the middle of the intestine. (Below blue) Average projection of confocal stacks of whole-mount zebrafish Tg(fabp6:GFP). Scale bar 100 μm. (Right blue) Representative cross-section of zebrafish intestine confirming high IEC expression for Tg(fabp6:GFP). Scale bar 25 μm. (Left orange) Whole-mount stereofluorescence image of 7 dpf zebrafish stable line Tg(Mmu.Fabp6:GFP) shows high levels of GFP expression in IECs in the middle of the intestine. Scale bar 100 μm. (Right orange) Representative cross-section of zebrafish intestine confirming high IEC expression for Tg(Mmu.Fabp6:GFP). Scale bar 25 μm. A smaller conserved region from mouse and 2 inclusive regions from human FABP6 did not drive IEC GFP expression in our zebrafish reporter assay. Throughout, the white dashed line marks the boundary of intestine and IECs. (E) Confocal whole-mount maximum projection image showing lack of overlap between Tg(fabp6:GFP) and the segment 2 marker TgBAC(lamp2-RFP). Scale bar 100 μm. (F) Confocal whole-mount average projection image showing lack of overlap between Tg(fabp6:GFP) and the segment 1 marker Tg(-4.5fabp2:DsRed). Scale bar 100 μm. (G) Common motifs detected in the cloned or corresponding region for each species colored by Homer motif score. |
| Gene: | |
|---|---|
| Fish: | |
| Anatomical Terms: | |
| Stage: | Days 7-13 |