
Fig. 4 S1
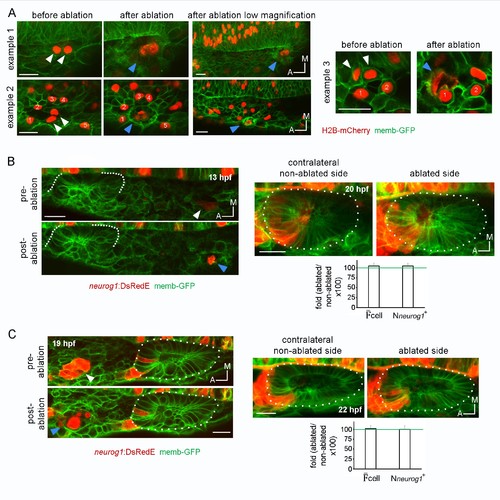
Calibration and specificity of ablation experiments. (A) Calibration of cell ablations. A laser pulse (as described in Materials and methods) was applied to embryos expressing H2B-mCherry in a mosaic manner lateral to the neural tube. In example 1, two nuclei were stained in the imaged region before ablation (white arrowheads). After the laser pulse, a red ablation bubble was observed as consequence of the death of the two stained cells (blue arrowhead). In example 2, the nuclei of neighbouring cells (numbered from 1 to 5) are surrounding two target cells (white arrowheads). Imaging after ablation indicated that the targeted cells died, but the neighbouring cells remained healthy and only slightly displaced in space. In example 3, a similar behavior as in example two can be observed, but the intact neighbouring cells are in close contact with the dead cells, highlighting the fact that ablation is highly specific and restricted to the targeted cells (white arrowheads, see also Video 14). (B) and (C) Ablation at a posterior region or a late developmental stage. On the left, laser ablation of neurog1+ cells located posterior to the otic epithelium at 13 hpf (B) or anterior to the otic vesicle at 19 hpf (C). White arrowheads indicate neurog1+ cells. Blue arrowheads localise the ablated region. The embryos received one laser pulse. On the right, z-projection images of neurog1 expression pattern inside vesicles at 20 (B) or (22) hpf from the ablated and contralateral non-ablated sides of the embryo are shown. Quantifications of the cell and the Nneurog1+ are shown as the fold change of ablated/non-ablated sidesx100 (n = 5 in (B) and n = 7 in (C)). Data are mean ± s.e.m. Scale bars, 20 µm. Dotted lines outline the limits of the otic epithelium/vesicle. |