
Fig. 2 S1
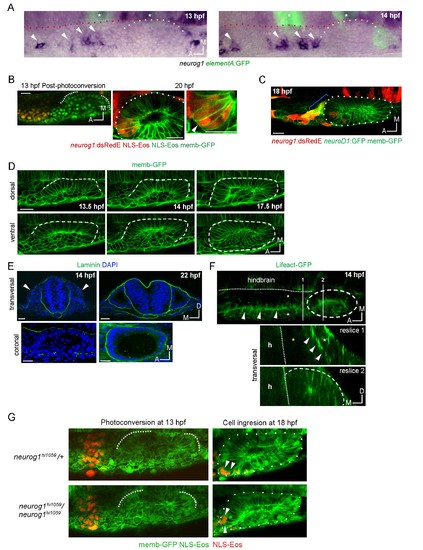
Morphogenetic features related to ingression. (A) Whole mount ISH for neurog1 from 13 and 14 hpf Tg(elA:GFP) embryos. This transgenic line expresses GFP in rhombomeres 3 and 5 (asterisks, at early stages rhombomere three express higher levels than rhombomere 5), facilitating the spatial localization of the otic placode. An immunostaining for GFP was performed after the in situ hybridisation. Dotted lines highlight the limits of the hindbrain (red) and the forming otic placode (white). White arrowheads indicate neurog1 expression. (B) Photoconversion of NLS-Eos stained nuclei at 13 hpf in a region anterior to the epithelium in TgBAC(neurog1:DsRedE)n16 embryos expressing memb-GFP. At 20 hpf photoconverted nuclei were observed in neurog1+ cells inside the vesicle (arrowhead). (C) GFP reporting neurod1 expression in the non-ingressing pool of cells at 18 hpf (in the SAG region) from Tg(neurod:GFP) embryos (blue bracket). Embryos are also TgBAC(neurog1:DsRedE)n16 and express memb-GFP. (D) Early stages of otic epithelialisation. Dashed line indicates the epithelialised part of the otic vesicle. Membranes are stained with memb-GFP. (E) Laminin staining at 14 and 22 hpf in transversal and coronal sections. Nuclei are counterstained with DAPI. White arrowheads indicate the forming otic placode. (F) 3D reconstruction (dorsal view) of an otic vesicle and its anterior region at 14 hpf from a Tg(actb1:Lifect-GFP) embryo. The white arrowheads indicate the actin layer that divides latero-medially the tissues lateral to the hindbrain in two regions (white and yellow asterisks, see also reslice 1). Reslices, built from the white bars 1 and 2 shown in the 3D reconstruction, show transversal sections anterior (reslice 1) or at the position (reslice 2) of the otic placode (dashed line). h: hindbrain (dotted line). (G) Cell ingression evaluated using NLS-Eos photoconversion at 13 hpf in neurog1hi1059 mutant embryos injected at 1 cell stage with memb-GFP and NLS-Eos mRNAs. White arrowheads indicate ingressed cells at 18 hpf. See also Figure 2H for a scheme of the morphological features described in this figure. Scale bars, 20 µm. Dotted lines in (A–C) outline the limits of the otic epithelium/vesicle. |