
Fig. 2
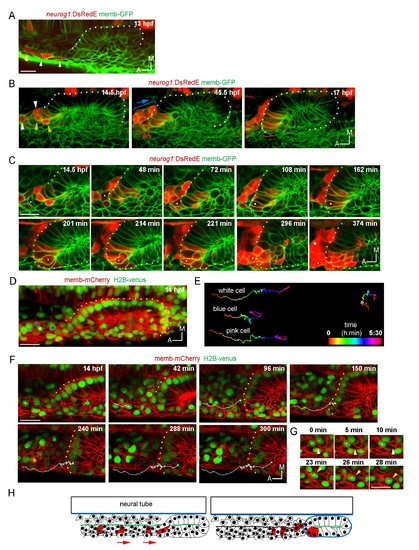
Ingression of neurog1+ cells. (A) The otic epithelium and its anterior region at 13 hpf. Arrowheads highlight neurog1+ cells outside the otic epithelium. (B) Selected frames of a 3D reconstruction (dorsal view) of the otic placode following the movement of the anterior neurog1+ cells. Arrowheads at 14.5 hpf indicate neurog1+ cells before epithelialisation (white: cells outside the placode, orange: ingressing cells). At 15.5 hpf red bracket identifies cells that will ingress (shown at 17 hpf) and blue bracket cells that will not ingress. In (A) and (B) the contrast of the red signal was increased to improve visualisation. (C) Selected planes of a 3D tracking of a single cell specifying during ingression (white dot). At 108 min the cell is already epithelialised. Asterisk indicates the SAG. (D–F) 3D tracking of single cells during ingression. (D) 3D reconstruction (dorsal view) showing the initial position of the tracked cells (white, pink and blue dots) at 14 hpf. The violet dot indicates the posterior vertex of the placode. (E) 2D visualisation of the 3D tracks shown in (D) are displayed in a temporal color code. Each track was displaced in the y axis for better visualisation. The track of the posterior vertex of the placode is shown on the right (see also Figure 2D). (F) Selected frames for the cell of the white track. At 150 min the cell is ingressing and completed at 240 min. At 300 min cytokinesis occurs. Membranes are stained with memb-mCherry. Embryos are Tg(actb:H2B-venusFP). (G) Selected planes showing cell-membrane displacements during migration of the cell tracked in (F). White arrowheads indicate protrusion of the cell front and orange arrowheads the position of the nucleus. (H) Schematic representation of the migration and ingression during epithelialisation (see Figure 2—figure supplement 1 for further details). Blue line: laminin, green line: actin layer, red cells: neurog1+ cells, red arrows: migration of neurog1+ cells towards the otic placode. Scale bars, 20 µm. Dotted lines outline the limits of the otic vesicle. |