
Fig. 1
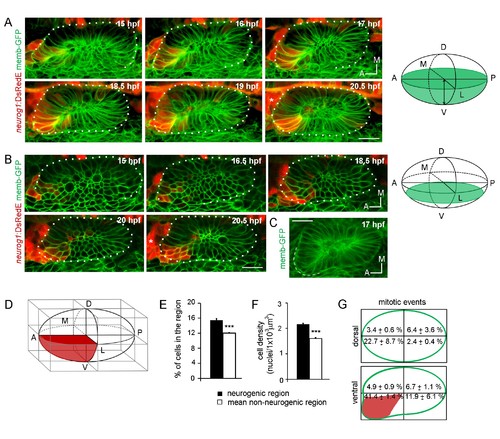
Specification dynamics and morphogenesis of the otic neurogenic domain. (A,B) Selected frames of a video of an otic placode from a TgBAC(neurog1:DsRedE)n16 embryo shown in (A) 3D reconstructions (dorsal view) and (B) coronal ventral planes. Green in the right schemes shows the region imaged. Membranes are stained with memb-GFP. D:dorsal, V:ventral, A:anterior, P:posterior, M:medial and L:lateral. The asterisk indicates the region where the SAG is forming. Medial to the otic vesicle, DsRedE is also expressed in the neural tube. (C) Averagez-projection (dorsal view) of the inner ear at 17 hpf. Dashed line indicates the protuberance. (D) Scheme of the rectangular cuboid used for quantifications. Neurogenic region is shown in red. (E,F,G) Quantification of the number of cells (E), the cellular density (F) and mitotic events (G) in the indicated regions at 19 hpf (n = 11) (E,F) or between 14 and 18.5 hpf (n = 2) (G). Data are mean ± s.e.m. ***p<0.0001 one sample t-test in (E) and unpaired t-test (F). Scale bars, 20 µm. Dotted lines outline the limits of the otic vesicle. |