
Fig. 3
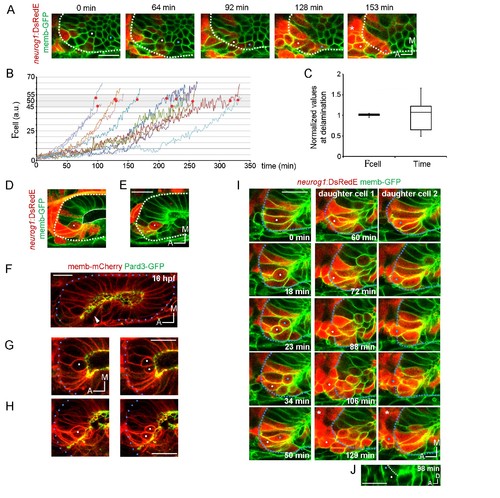
Local specification and divisions of neurog1 expressing cells. (A) Selected planes showing DsRedE expression dynamics in locally specified cells (white and blue dots) from TgBAC(neurog1:DsRedE)n16 embryos expressing memb-GFP. Asterisk indicates the SAG. The embryo is 16.5 hpf at the beginning of the time-lapse. (B) Quantification of DsRedE fluorescence over time for 11 cells locally inducing neurog1. Red dots indicate beginning of delamination. The gray region highlights the interval of fluorescence levels at which all cells delaminate. (C) Box plot made from the quantifications shown in (B), illustrating that at the moment of delamination, the time elapsed from the initiation of neurog1 expression is highly variable, while the expression levels are not. The value for each cell was normalized by the mean of the cell group. (D,E) neurog1+ mitotic cells (white dots) contacting (D) or not (E) the central lumen (dashed line). 19 (D) and 17 (E) hpf embryos are shown. (F) Pard3-GFP localisation in the central lumen and the anterolateral region (white arrowhead). Membranes are stained with memb-mCherry. (G,H) Divisions (white dots) located in the lumen (G) or the apical scaffold (H, z-projection). 20 (G) and 18 hpf (H) embryos are shown. (I) Selected planes from a 3D time-lapse of a neurog1+ mitosis. White and blue dots track the daughter cells. Dashed lines indicate the approximated limit of the vesicle. Selected planes for each daughter cell are shown from 60 min onwards. At 129 min cells are delaminated. Asterisk indicates the SAG. The embryo is 18 hpf at the beginning of the time-lapse. (J) Reslice of a frame at 98 min from the video shown in (H) showing the z proximity between the tracked daughter cells during delamination (the red signal was removed for better visualisation). Scale bars, 20 µm. Dotted lines outline the limits of the otic vesicle. |