
FIGURE
Fig. S4
Fig. S4
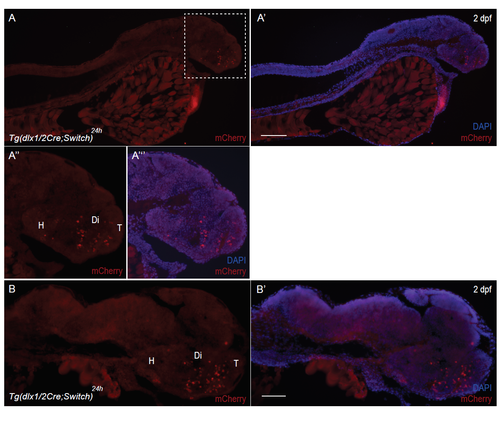
Supplementary material. Suppl. Fig. 4: Restriction of mCherry labeling to the brain. (A-B) Immunohistochemical labeling with antibodies against mCherry of cryosections of Tg(dlx1/2Cre;Switch)24h 2 dpf embryos. Each panel has mCherry staining (red) and DAPI nuclear staining (blue) to highlight the morphology of the entire fish, devoid of mCherry fluorescent staining, except for the brain. The head of the fish delineated by the white dotted line in A is enlarged in A” and A’”. Scale bar: 100 μm. |
Expression Data
Expression Detail
Antibody Labeling
Phenotype Data
Phenotype Detail
Acknowledgments
This image is the copyrighted work of the attributed author or publisher, and
ZFIN has permission only to display this image to its users.
Additional permissions should be obtained from the applicable author or publisher of the image.
Reprinted from Developmental Biology, 427(1), Solek, C.M., Feng, S., Perin, S., Weinschutz Mendes, H.C., Ekker, M., Lineage tracing of dlx1a/2a and dlx5a/6a expressing cells in the developing zebrafish brain, 131-147, Copyright (2017) with permission from Elsevier. Full text @ Dev. Biol.