
Fig. S2
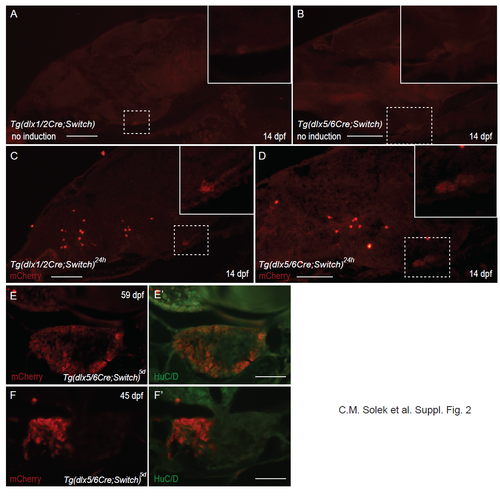
Suppl. Fig. 2: mCherry expression in pituitary gland. (A-D) Immunohistochemical labeling with antibodies against mCherry of cryosections of 14 dpf larvae. Tg(dlx1/2Cre;Switch) (A,C) and Tg(dlx5/6Cre;Switch) (B,D) animals were mock treated with EtOH (no induction; A,B) or with 10 μM 4-OHT at 24 hpf (C,D). Autofluorescence in the pituitary is visible in A and B with white dotted line areas enlarged in insets. mCherry immunohistochemical fluorescent signal is visible in C and D with white dotted line areas enlarged in insets. (E,F) mCherry expression in a subset of cells of the pituitary in juvenile animals. Immunohistochemical labeling with antibodies against mCherry (red) and HuC/D (green) of cryosections of Tg(dlx5/6Cre;Switch)5d showing partial labeling of the anterior pituitary cells devoid of HuC/D expression. Scale bar: 50 μm. |
Reprinted from Developmental Biology, 427(1), Solek, C.M., Feng, S., Perin, S., Weinschutz Mendes, H.C., Ekker, M., Lineage tracing of dlx1a/2a and dlx5a/6a expressing cells in the developing zebrafish brain, 131-147, Copyright (2017) with permission from Elsevier. Full text @ Dev. Biol.