
FIGURE
Fig. S3
Fig. S3
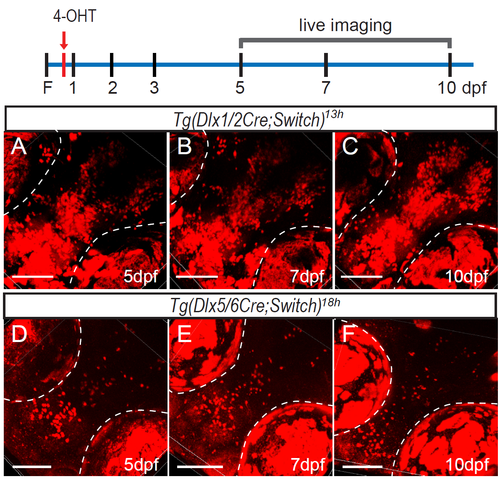
Suppl. Fig. 3: Induction of CreERT2recombinase activity inTg(dlx1/2Cre;Switch)andTg(dlx5/6Cre;Switch)embryos at the onset of transgene expression. (A-C) Tg(dlx1/2Cre;Switch)13h embryos imaged at 3 dpf (A, n=6), 7 dpf (B, n=6) and 10 dpf (C, n=7). (D-F) Tg(dlx5/6Cre;Switch)18h embryos imaged at 3 dpf (D, n=12), 7 dpf (E, n=10) and 10 dpf (F, n=5). Scale bar: 100 μm. |
Expression Data
Expression Detail
Antibody Labeling
Phenotype Data
Phenotype Detail
Acknowledgments
This image is the copyrighted work of the attributed author or publisher, and
ZFIN has permission only to display this image to its users.
Additional permissions should be obtained from the applicable author or publisher of the image.
Reprinted from Developmental Biology, 427(1), Solek, C.M., Feng, S., Perin, S., Weinschutz Mendes, H.C., Ekker, M., Lineage tracing of dlx1a/2a and dlx5a/6a expressing cells in the developing zebrafish brain, 131-147, Copyright (2017) with permission from Elsevier. Full text @ Dev. Biol.