
Fig. S9
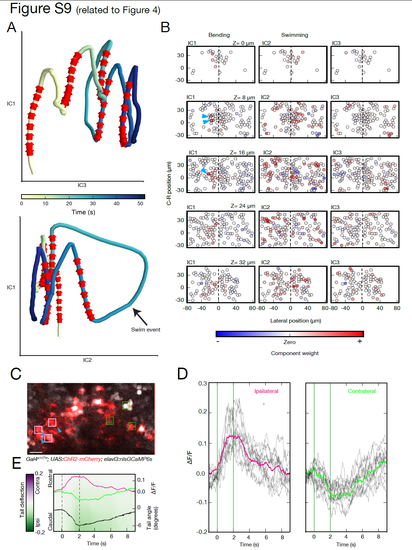
Dimensionality reduction representation of circuit dynamics (related to Figure 4) (A) The network activity of 486 neurons is projected into a simplified three dimensional space obtained by independent component analysis. The color encodes the temporal evolution of the network state, with stimulation phases indicated by red arrows. Each stimulation epoch shifts the circuit into a different state, with a return towards baseline following the end of stimulation. In this compact representation, the trajectory of the network activities associated with tail bending are well separated from the large swim bout. (B) Spatial patterns of the independent components at each imaged plane. The relative weights of neurons in the independent component representation are used to visualize the spatial organization of these common activity modes across the circuit. IC1, capturing the dynamics temporally locked to tail bending, shows a focused and lateralized pattern near the stimulation site. IC2 (swimming) and IC3 (slow circuit dynamics), have a broader and more symmetric distribution of activity across the midline. (C) Induced network activity resulting from nMLF stimulation driving behavior. Stimulated neurons are marked with a blue arrow. Scale bar is 10 μm. (D) Two different activity patterns in the circuit associated with the tail deflection can be detected, when comparing the neuronal responses ipsilateral versus contralateral to the stimulation side (light pink and green squares in C respectively). While in cells ipsilateral to the stimulation an increase in activity is detected (grey lines for single trials, pink trace for mean), a signal decrease in some of the contralateral neurons is noticeable (green trace for mean). (E) The activity profile recorded on the contralateral side (green trace), although temporally synchronized to the stimulation and tail deflection, shows a distinct temporal shift (see main text for quantification). |