
Fig. 6
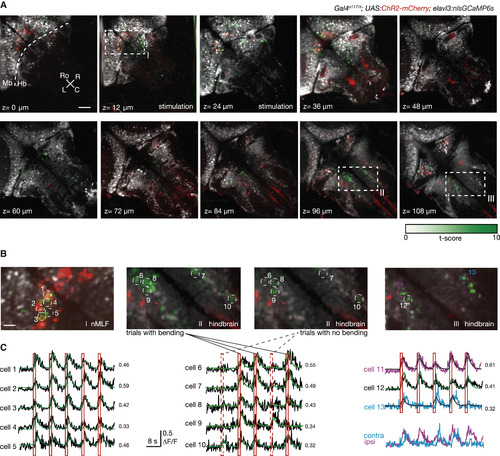
Imaging the Activity Associated with Behavior in Distant Brain Regions (A) Brain activity induced by nMLF activation. Activity across a large volume of the brain is captured by sequentially imaging ten planes, each separated by 12 μm (at four frames per second). Remote focusing of the imaging plane is combined with the 3D control of the photostimulation pattern to acquire GCaMP signals at each plane while keeping the stimulation targeted on the behaviorally identified neurons in the nMLF. Pixelwise regression analysis of the temporal series is used to pinpoint brain regions with activity profiles matching the stimulation epochs. For stimulation trials resulting in tail bending, the corresponding t-statistic for each pixel is averaged to create a map showing hotspots with activity associated with the behavioral outcome induced (in green). Also shown: ChR2-mcherry expression (in red), and nlsGCaMP6s expression (in gray). The scale bar represents 50 μm. (B) Higher-magnification view of the regions with dashed outlines in (A), focusing on areas with a high average t-statistic. In the plane at the level of the nMLF (z = 12 μm), where stimulation occurs, the activity is strongly lateralized. However, in the more dorsal layers, regions on both sides of the rostral and caudal hindbrain are active during tail bending. For the plane z = 96 μm, two maps are generated for the t-statistics: one considering trials with tail bending events and the other only trials with no behavior. The scale bar represents 10 μm. (C) Single-cell profiles of the induced activity in the hindbrain. Example ΔF/F traces (black), from selected neurons in (B), are shown along with the fit (green) and the corresponding coefficient of determination (R2) from the regression analysis. Red solid bars indicate trials that resulted in behavior, whereas trials without behavior outcome are indicated with dashed red bars. Two response profiles are shown (magenta and cyan; in detail on the right side), which have a noticeable difference in the timing of their responses. |