
Fig. S4
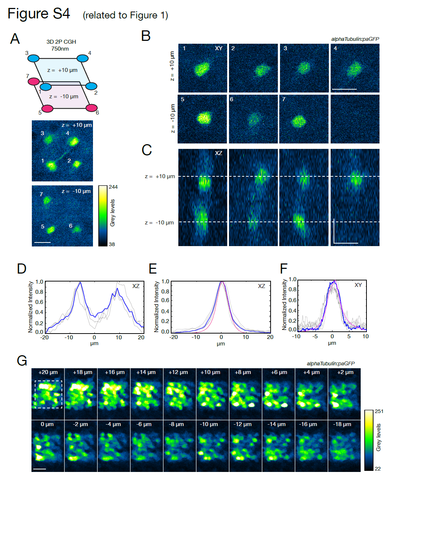
paGFP photoactivation (related to Figure 1). (A) Fluorescence signal measured in a zebrafish larva with pan-neuronal expression of paGFP after photoactivation with the 3D pattern shown in Figure 1C. The pattern consists of 7 illumination circles, 6 μm in diameter, placed at the corners of a 20x20x20 μm3 cube in the optic tectum. One corner was not illuminated to provide a comparison. (B) XY view of the fluorescent stack of the corresponding planes. Note that no fluorescence is detected from the plane at -10 μm in the region corresponding to the non-illuminated corner. (C) A side (XZ) view of the fluorescent signal. No fluorescence is detected in the region around -10 μm corresponding to the non-illuminated corner. (D) Intensity profiles in the XZ view from C. The two photoconverted foci, although with some extended and overlapping tails, are clearly separated and distinguishable. In blue is the average (3 measurements). (E) For comparison, we photoconverted paGFP with a single circle, 6 μm in diameter. Individual intensity profiles in the XZ view are shown in grey. In blue is the average across 4 photoconverted spots. The resulting FWHM measured along the z-axis is 8.9 ± 0.9 μm. In magenta is the average of the profiles recorded from a thin fluorescein layer. The photoconversion tails in the paGFP Z profile measured in vivo, can be explained by light scattering in the tissue (as reported in Hernandez et al., 2016). (F) XY intensity profiles from dataset in E (average in blue, fluorescein reference in magenta). The FWHM is 5.79 ± 0.91 μm, (G) paGFP expression coverage. A 20x20x20 μm3 cube is photoconverted by raster scanning the imaging beam at 750 nm. The stack acquired at 920 nm shows that, although with different expression levels, the majority of the cells are expressing paGFP. It is possible however to find cells without detectable paGFP photoconversion (<7.5% ± 2.2%, across different planes). This could be due to cells where the promoter is not active. |