
Fig. 7
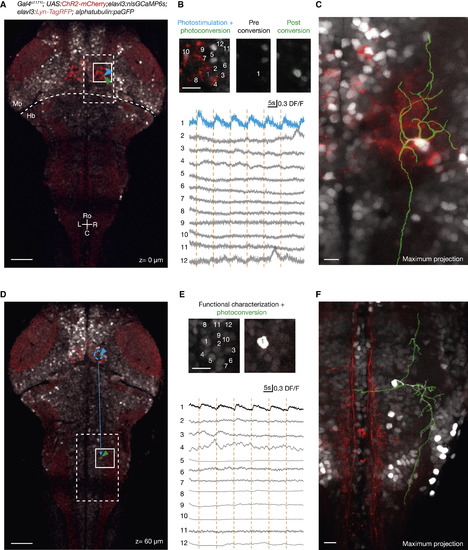
Morphological Reconstruction of Functionally Identified Neurons with Photoactivatable GFP (A) Combined ChR2 photostimulation, GCaMP imaging, and paGFP photoconversion. A larval brain with pan-neuronal expression of nlsGCaMP6s (gray) and Lyn-TagRFP (light red), ubiquitous expression of paGFP, and cells in the nMLF expressing ChR2 (bright red) are shown. The scale bar represents 50 μm. (B) Photostimulation + photoactivation protocol. First, a neuron is targeted for ChR2 photostimulation at 920 nm (cell 1; blue) while nlsGCaMP6s signals are imaged at 1,020 nm. The targeted neuron responds reliably to the stimulation. Such triggered activity is not detected in surrounding neurons. Afterward, the same photostimulated neuron is targeted for 2P paGFP photoactivation with 1 s of 750-nm illumination, resulting in a strong increase in fluorescence. Image extents are outlined in (A) in white. (C) Reconstruction of the targeted cell. After the diffusion of paGFP, the cell is imaged and its basic morphology can be traced. Image sizes are outlined in (A) with a dashed white box. (D) Morphological characterization of downstream neurons in the fish hindbrain recruited during nMLF photostimulation. As shown in Figure 6, activation of nMLF neurons drives activity in hindbrain neurons located 250–300 μm caudally. The scale bar represents 50 μm. (E) From a group of neurons in the hindbrain, imaged during nMLF stimulation, a secondary activated cell is identified and can be photolabeled with paGFP. Image sizes are outlined in (D) in white. (F) After applying the paGFP photolabeling protocol, functionally identified downstream neurons can be traced to reveal their morphology. Image sizes are outlined in (D) in dashed white. The scale bars in (B), (C), (E), and (F) represent 10 μm. Hb, hindbrain; Mb, midbrain. |