
Fig. 4
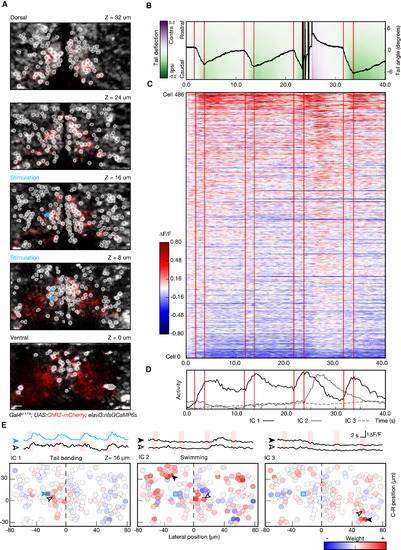
Combining Photostimulation with Functional Imaging and Behavior Recording (A) Multiplane recording of the activity of 486 cells during optogenetically induced behavior. Planes imaged in the midbrain of fish expressing ChR2-mcherry (red) and nlsGCaMP6s (gray) are shown. ROIs, corresponding to the cell bodies selected for analysis, are highlighted in white, and units selected for photostimulation are shown in cyan. (B) Kinematics of the tail in response to stimulation. This example shows the temporal evolution of the tail angle for four repetitions of 2-s photostimulation (red lines indicate stimulation onset and offset). Note that, at the third photostimulation episode, after an initial bending of the tail toward the side of the stimulation, the fish responded with a large-amplitude swim. Trials with this kind of transition bending-swimming were common in all the larvae tested (n = 3) and occurred in approximately 20% of the trials. (C) Raster plot showing the activity for the recorded neuronal population, with the same timescale as the behavior shown in (B). A small subset of neurons shows a reliable activity pattern temporally locked to stimulation and tail bending. A larger number of neurons show an activity increase corresponding to the large-amplitude swim. (D) Representation of temporal patterns in population activity by ICA. The first three components of the representation are shown: IC1 is associated to the activity during tail bending; IC2 represents the activity picked during the large-amplitude swimming bout; and IC3 represents a slow modulation in the activity not linked to a detectable behavior. (E) Circuit activity maps for the plane at z = 16 μm, showing the spatial distribution across the population of the three activity components. Representative traces, corresponding to the different ICs, are shown for the cells indicated with arrowheads in the corresponding maps (blue trace represents a stimulated cell). For IC2 and IC3, the calculated laterality indices were −0.13 ± 0.11 and 0.06 ± 0.15 (mean ± SD; p value 0.12 and 0.22), indicating slight, if any, ipsilateral bias. IC1, on the other hand, is significantly lateralized (−0.36 ± 0.15; p value 0.01). The scale bars represent 10 μm. |