
Fig. 3
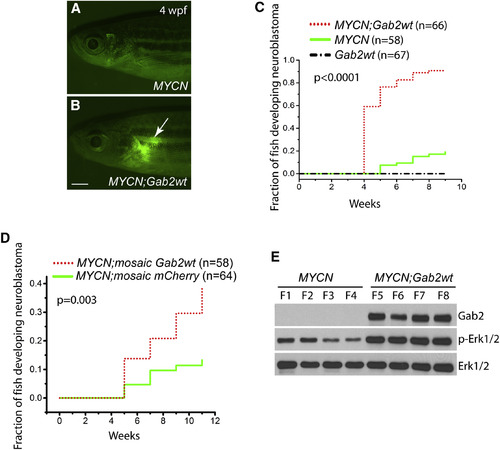
GAB2 and MYCN Synergize in Neuroblastomagenesis (A and B) Fluorescence micrographs of MYCN (A) and compound MYCN;Gab2wt (B) transgenic fish. Note EGFP-expressing tumor in the interrenal gland (arrow) of MYCN;Gab2wt compound transgenic fish at 4 weeks postfertilization (wpf). Scale bar, 1 mm. (C) Kaplan-Meier analysis of the cumulative frequency of neuroblastoma induction over 9 weeks in the indicated stable transgenic zebrafish lines (MYCN-only versus MYCN;Gab2wt, p < 0.0001 by log-rank test). (D) Kaplan-Meier analysis of the cumulative proportion of MYCN transgenic fish mosaically overexpressing mCherry alone (MYCN;mosaic mCherry) or co-expressing mCherry with Gab2wt (MYCN;mosaic Gab2wt) over 11 weeks. Tumor incidence in fish expressing Gab2wt and mCherry was increased over results for mCherry overexpression alone (p = 0.003 by log-rank test). (E) Immunoblot of Shp2-Erk pathway components in neuroblastomas isolated from MYCN-only or MYCN;Gab2wt transgenic fish. Total Erk1/2 levels serve as loading controls. |
| Gene: | |
|---|---|
| Antibodies: | |
| Fish: | |
| Anatomical Term: | |
| Stage Range: | Days 21-29 to Adult |
| Fish: | |
|---|---|
| Observed In: | |
| Stage Range: | Days 21-29 to Adult |