
FIGURE
Fig. 8
Fig. 8
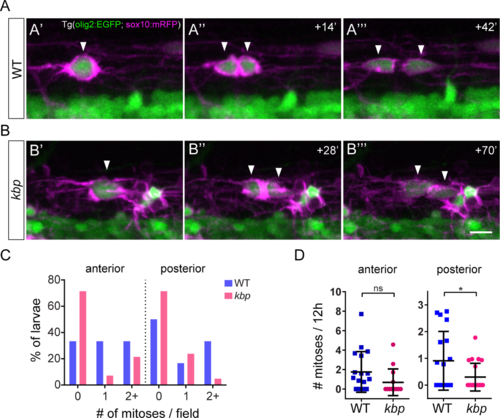
Impaired OPC proliferation in the posterior spinal cord of kbp mutants. A, B, Time-lapse stills showing representative OPC mitoses in WT (A) and kbp mutants (B); arrowheads indicate mother and daughter cells. Scale bar: 10 μm. C, Proportion of larvae with OPC mitoses. Fewer mutants have any OPC mitoses compared to WTs. D, Rate of OPC mitoses (per 12-hour) is significantly decreased only in the posterior spinal cord of kbp mutants. Data from N = 18 WT and N = 14 mutants (anterior) and N = 18WT and N = 21 mutants (posterior). * indicates P<0.05; see text for details. Error bars indicate ± SD. |
Expression Data
| Genes: | |
|---|---|
| Fish: | |
| Anatomical Terms: | |
| Stage Range: | Pec-fin to Day 4 |
Expression Detail
Antibody Labeling
Phenotype Data
| Fish: | |
|---|---|
| Observed In: | |
| Stage Range: | Pec-fin to Day 4 |
Phenotype Detail
Acknowledgments
This image is the copyrighted work of the attributed author or publisher, and
ZFIN has permission only to display this image to its users.
Additional permissions should be obtained from the applicable author or publisher of the image.
Full text @ PLoS One