
Fig. S2
- ID
- ZDB-FIG-160516-8
- Publication
- Ando et al., 2016 - Clarification of mural cell coverage of vascular endothelial cells by live imaging of zebrafish
- Other Figures
- All Figure Page
- Back to All Figure Page
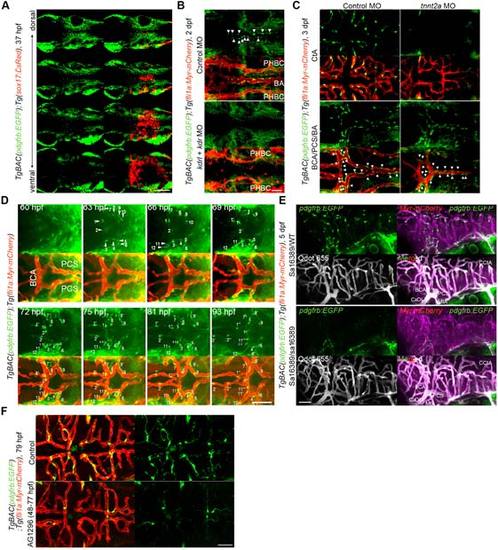
MC coverage of cranial vessels. (A) Confocal images of cranial region in the TgBAC(pdgfrb:EGFP);Tg(sox17:DsRed) embryo at 37 hpf. Dorsal view, anterior to the left. Multiple single z-plane images are shown (from the top (dorsal) to the bottom (ventral)). Left, pdgfrb:EGFP; right, the merged images of pdgfrb:EGFP(green) and sox17:DsRed(red). Note that EGFP-positive cells were not identical to DsRed-positive endodermal cells.(B) Confocal images of hindbrain vasculature in the 2 dpf TgBAC(pdgfrb:EGFP);Tg(fli1a:Myr-mCherry) embryos injected with control MO (upper two panels) or both kdrl and kdrMOs (lower two panels). Upper, pdgfrb:EGFP; lower, the merged images of pdgfrb:EGFP(green) and fli1a:Myr-mCherry(red). Arrowheads indicate the MCs covering the BA. Note that kdrl/kdr-double morphant exhibited not only defective formation of BA but also lack of MCs in the midline of the cerebral base. (C) Confocal images of CtA (upper tow panels) and the vessels in the cerebral base (BCA/PCS/BA, lower two panels) in the 3 dpf TgBAC(pdgfrb:EGFP);Tg(fli1a:Myr-mCherry) larvae injected with control MO (left column) or tnnt2aMO (right column). Upper, pdgfrb:EGFP; lower, the merged images of pdgfrb:EGFP(green) and fli1a:Myr-mCherry(red). Arrowheads indicate the MCs covering the BCA, PCS and BA.Note that MC coverage was observed in the vessels in the cerebral base but not in the CtA of tnn2a morphants. (D) Time-lapse confocal images of the cranial vasculature in the TgBAC(pdgfrb:EGFP);Tg(fli1a:Myr-mCherry) embryo (60-93 hpf). Dorsal view, anterior to the left. Upper, pdgfrb:EGFP; lower, the merged images of pdgfrb:EGFP(green) and fli1a:Myr-mCherry(red). Numbers indicate individual EGFP-positive cells emerging around the PCS and BCA. EGFP-positive cells designated with prime marks indicate progeny cells. (E) Confocal images of cranial vessels of pdgfrb heterozygous (upper two panels, sa16389/WT) and homozygous (lower two panels, sa16389/sa16389) larvae in theTgBAC(pdgfrb:EGFP);Tg(fli1a:Myr-mCherry) background at 5 dpf. Lateral view, anterior to the left. To assess blood flow and blood vessel lumenization, Qdot 655 fluorescent probe was injected into the common cardinal vein just before imaging.Upper left, pdgfrb:EGFP; lower left, Qdot 655; upper right, the merged images of pdgfrb:EGFP(green) and fli1a:Myr-mCherry(magenta); lower right, the merged images of pdgfrb:EGFP(green), fli1a:Myr-mCherry(magenta) and Qdot 655 (white). (F) Confocal images of CtA in the TgBAC(pdgfrb:EGFP);Tg(fli1a:Myr-mCherry) larva treated with vehicle (upper) or 20 µM AG1296 (lower) during 48-77 hpf. Dorsal view, anterior to the left. Left, the merged images of pdgfrb:EGFP(green) and fli1a:Myr-mCherry(red); right, pdgfrb:EGFP. BA, basilar artery; PHBC, primordial hindbrain channel; CCtA, cerebellar central artery; BCA, basal communicating artery; PCS, posterior communicating segment; CaDI, caudal division of the internal carotid artery; MtA, metencephalic artery. Scale bars, 50 µm. |